Open Access
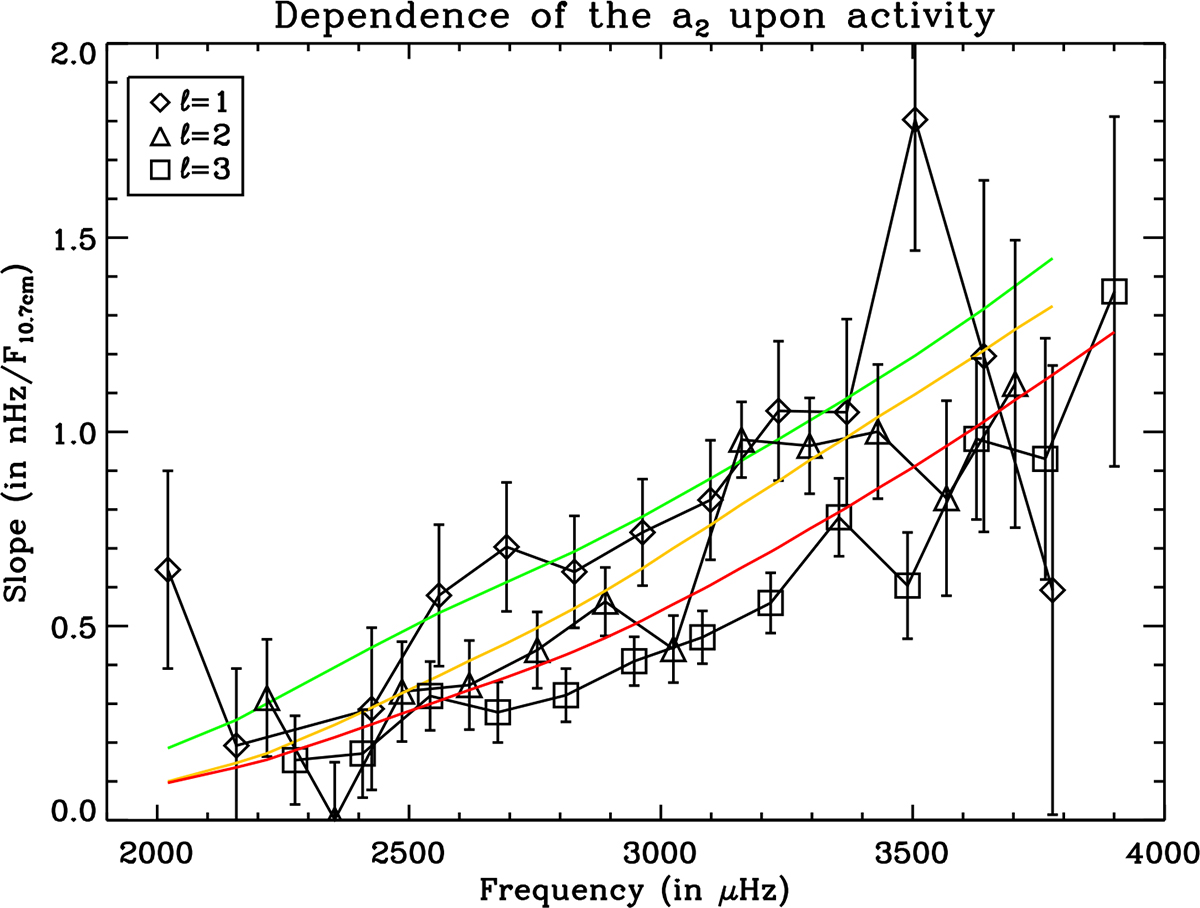
Fig. 8.
Download original image
Slope of the dependence of the a2-coefficient to the 10.7 cm flux as a function of frequency for degrees l= 1, 2 and 3. A second-order polynomial fit is shown for each degree: l= 1 (green line), l = 2 (orange line), and l = 3 (red line). The data used were the resolved data locally fitted.
Current usage metrics show cumulative count of Article Views (full-text article views including HTML views, PDF and ePub downloads, according to the available data) and Abstracts Views on Vision4Press platform.
Data correspond to usage on the plateform after 2015. The current usage metrics is available 48-96 hours after online publication and is updated daily on week days.
Initial download of the metrics may take a while.