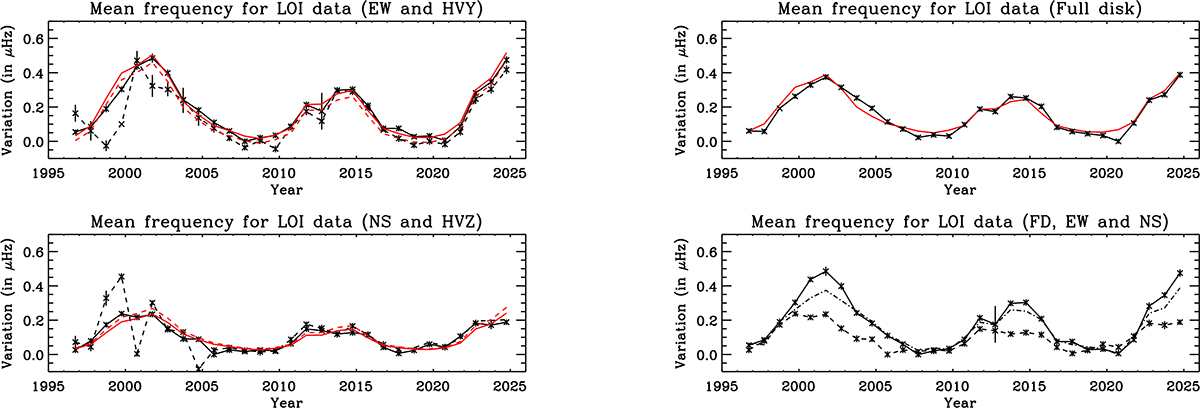
Fig. 9.
Download original image
Mean mode frequency variation as a function of time. (Top, left) averaged over the l= 1 and 2 modes for the EW difference (continuous line), for the EW HV (dashed line), and the respective fits of the variations to the F10.7 cm flux (in red). (Top, right) averaged over the l= 0,1 and 2 modes for the global fit of the FD data (continuous line) and the fit of the variations to the F10.7 cm flux (red line). (Bottom, left) averaged over the l= 1 and 2 modes for the NS difference (continuous line), for the NS HV (dashed line), and the respective fits of the variations to the F10.7 cm flux (in red) (bottom, right) for comparison: the averaged EW difference signal (continuous line), the averaged NS difference signal (dashed line) and the averaged FD signal (dash-dotted line).
Current usage metrics show cumulative count of Article Views (full-text article views including HTML views, PDF and ePub downloads, according to the available data) and Abstracts Views on Vision4Press platform.
Data correspond to usage on the plateform after 2015. The current usage metrics is available 48-96 hours after online publication and is updated daily on week days.
Initial download of the metrics may take a while.