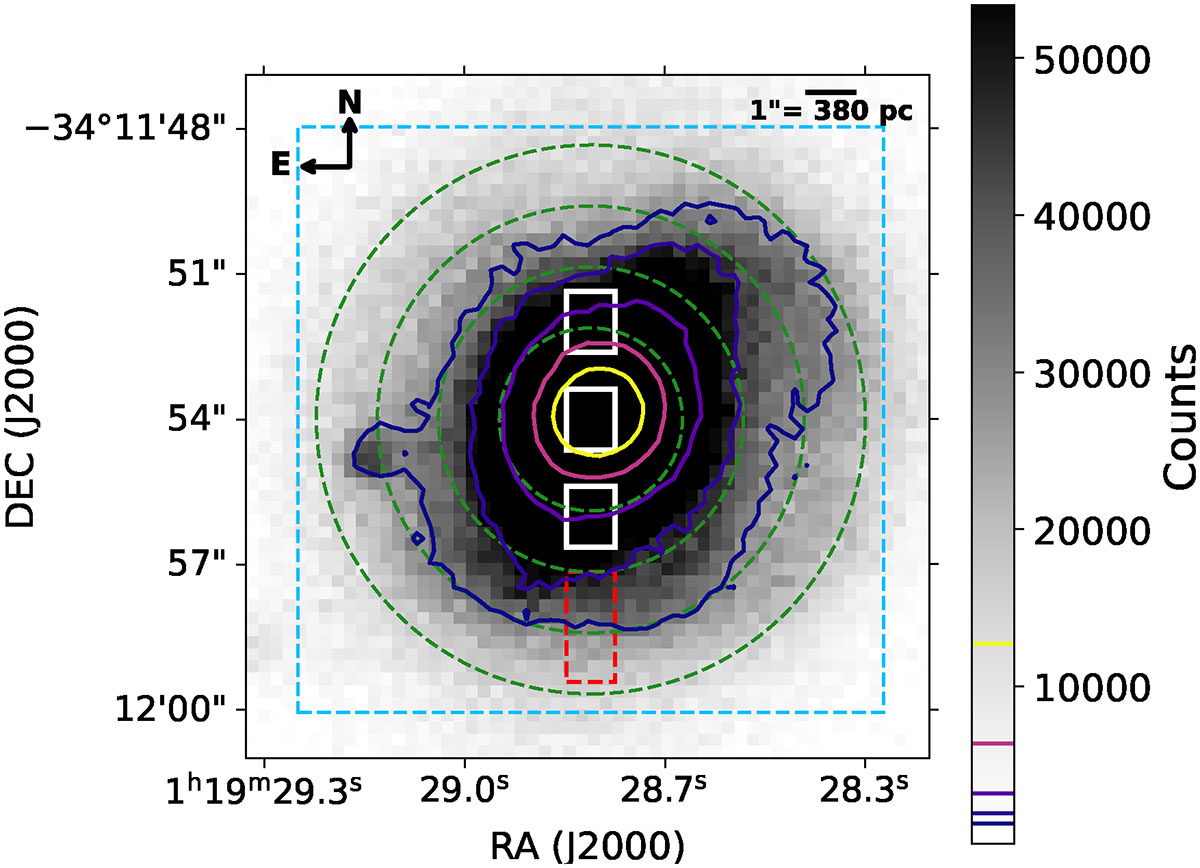
Fig. 1.
Download original image
Acquisition image of GSN 069. Flux contours follow the shown color scale. The green dashed circles mark IPOL aperture areas with radii of ∼3σ (2.1″), ∼5σ (3.5″), ∼7σ (4.9″), and ∼9σ (6.3″), where σ is the seeing value during IPOL observations, which remained stable at ∼0.7″. The white boxes indicate the north, nucleus, and south regions used for PMOS extractions (see text), while the red box show the southern spot extraction region. The blue dashed box outlines the same 12″ × 12″ area as the Chandra image of GSN 069 shown in panel d of Extended Data Fig. 1 in Miniutti et al. 2019. The spot is not visible in our optical FORS2 IPOL images, but appears in those Chandra observations and in the MUSE continuum-subtracted Hα image (Fig. B.2 and Appendix B).
Current usage metrics show cumulative count of Article Views (full-text article views including HTML views, PDF and ePub downloads, according to the available data) and Abstracts Views on Vision4Press platform.
Data correspond to usage on the plateform after 2015. The current usage metrics is available 48-96 hours after online publication and is updated daily on week days.
Initial download of the metrics may take a while.