Open Access
Fig. D.1.
Download original image
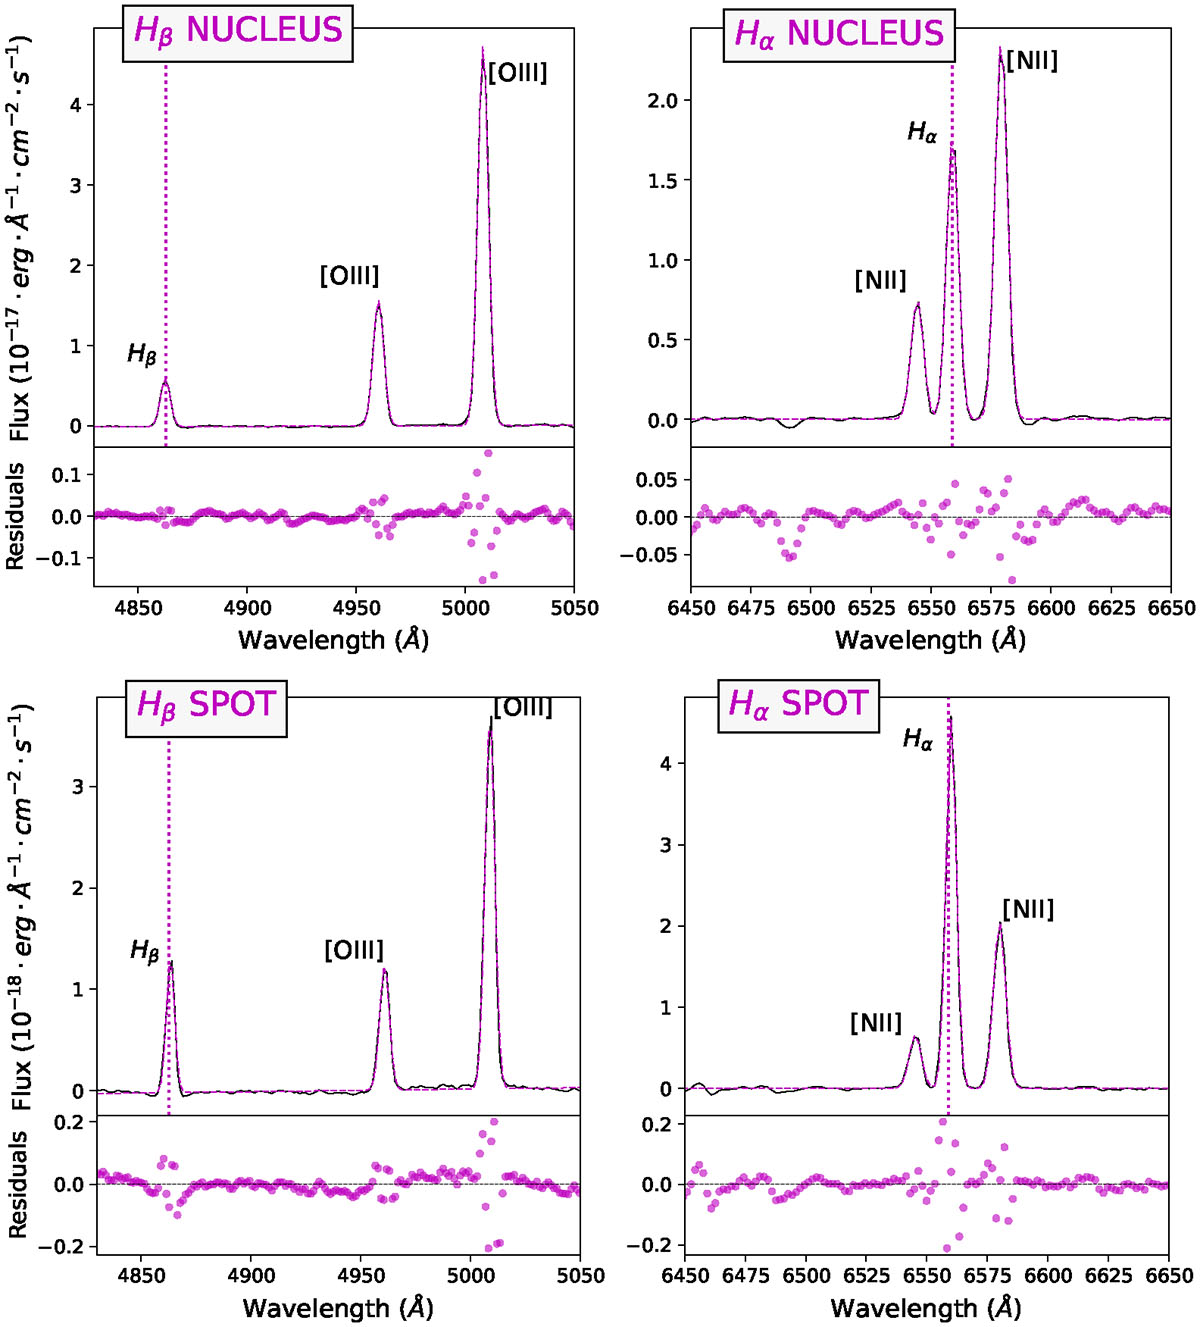
Line fitting and corresponding residuals in the Hβ and Hα wavelength ranges for the direct nucleus spectrum of GSN 069 (upper panel) and the southern spot (lower panel)).
Current usage metrics show cumulative count of Article Views (full-text article views including HTML views, PDF and ePub downloads, according to the available data) and Abstracts Views on Vision4Press platform.
Data correspond to usage on the plateform after 2015. The current usage metrics is available 48-96 hours after online publication and is updated daily on week days.
Initial download of the metrics may take a while.