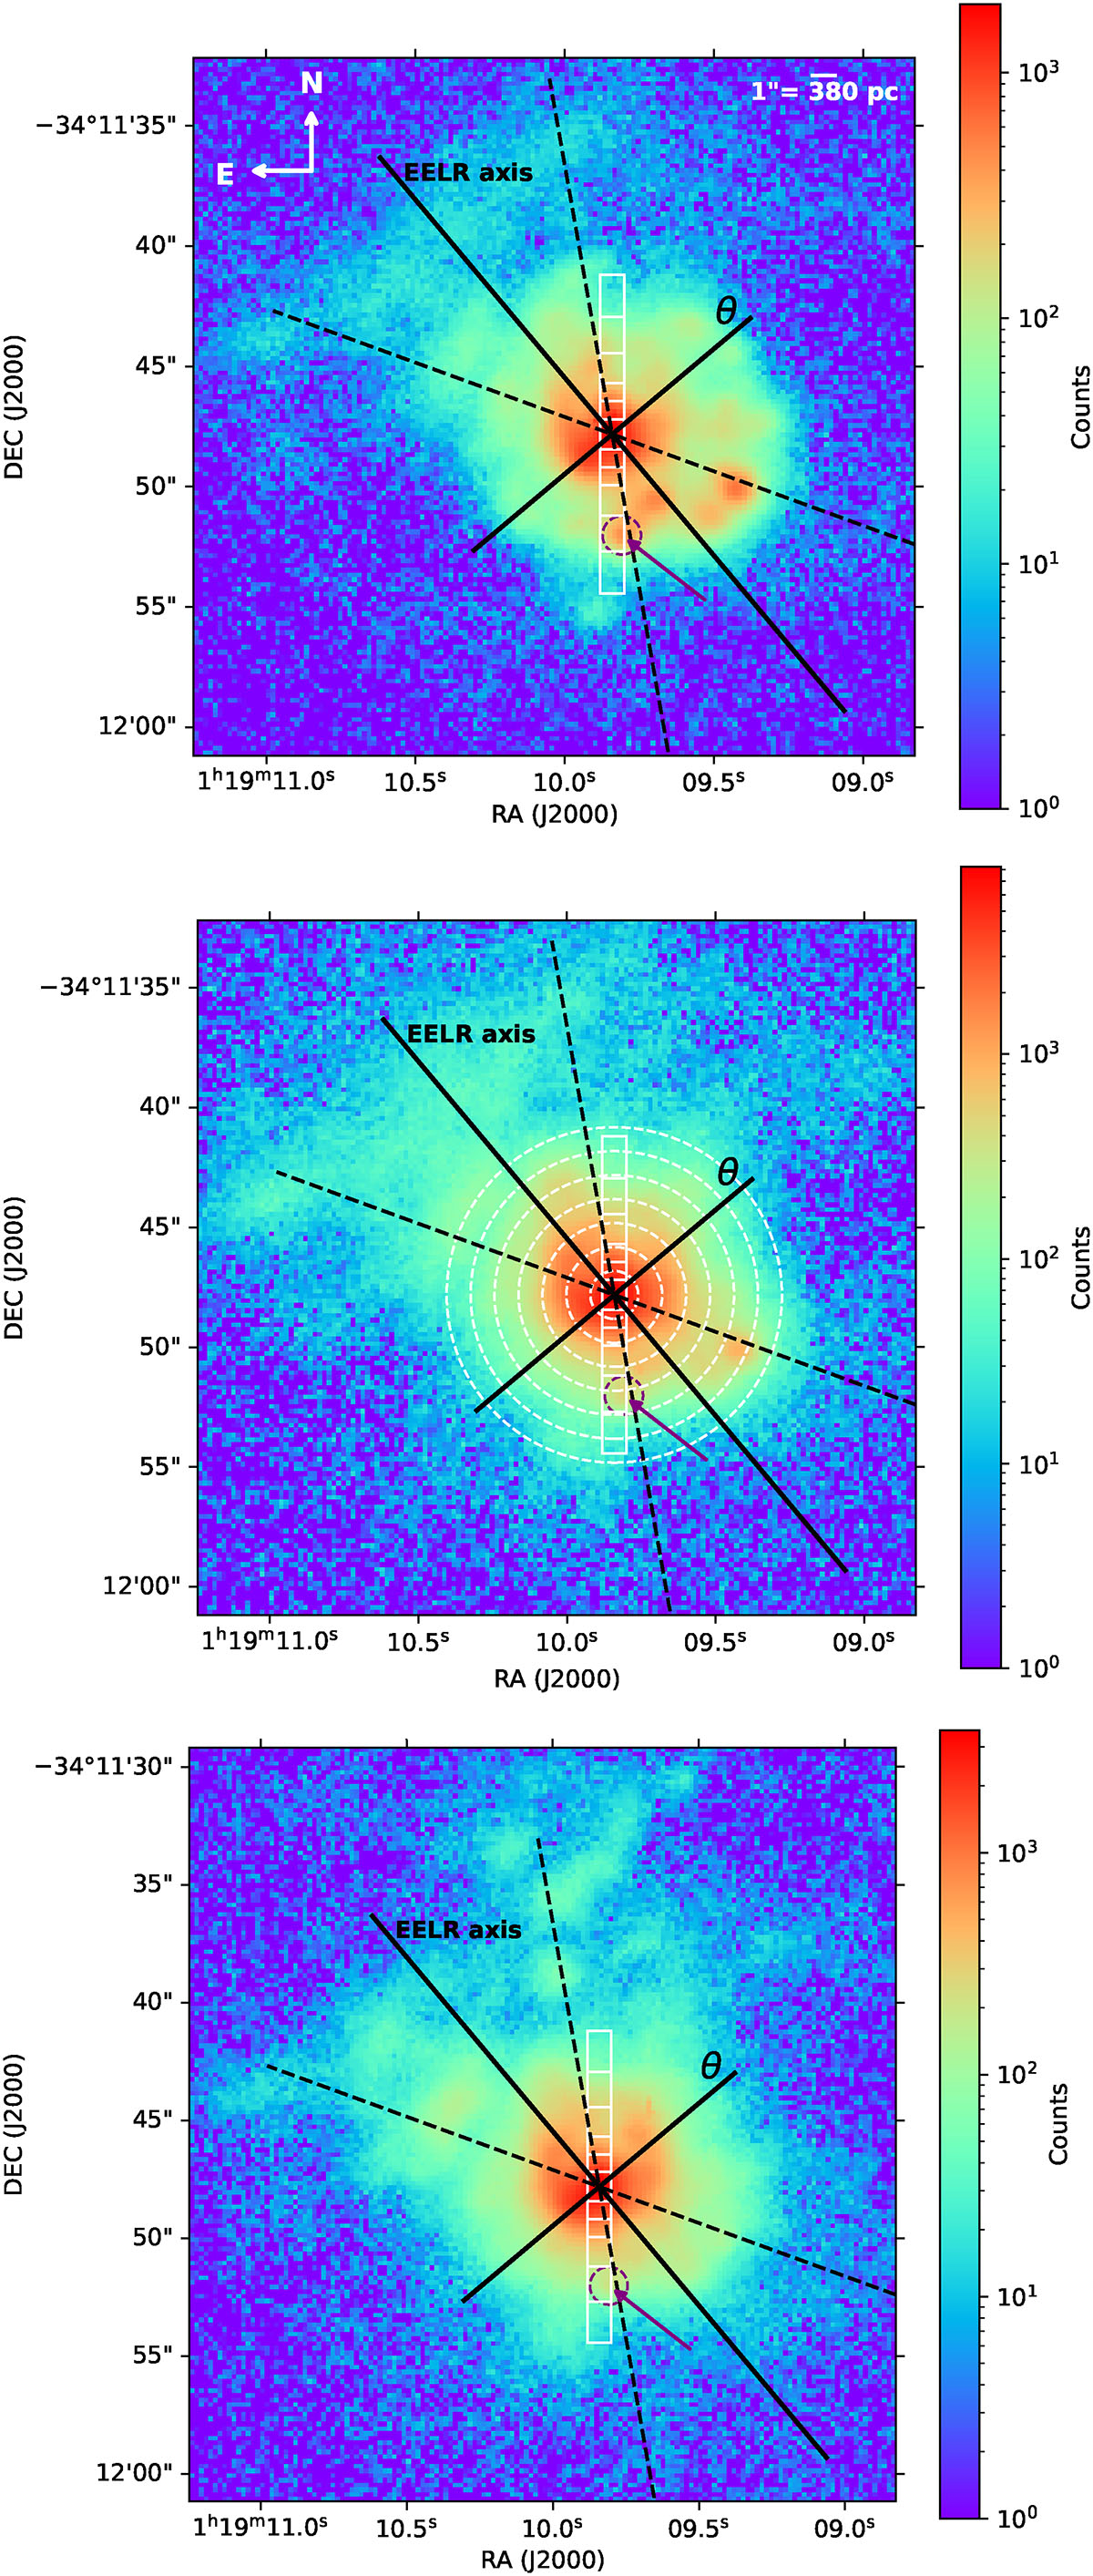
Fig. B.2.
Download original image
Upper panel: MUSE continuum-subtracted Hα image. Middle panel: MUSE continuum-subtracted [OIII]λ5007.Lower panel: MUSE continuum-subtracted [NII]λ6583. The position of the southern spot is marked with a purple arrow and circle. The white solid boxes denote the spectropolarimetry bins corresponding to Fig. 2, while the dashed white circles account for the annular regions of Fig. 4 (only shown in the middle panel for clarity). The direction corresponding to the polarization angle θ and its perpendicular are superimposed. The latter direction represents the proposed EELR axis. The black dashed lines represent an arbitrary 60°aperture for the ionization cones, drawn to guide the eye.
Current usage metrics show cumulative count of Article Views (full-text article views including HTML views, PDF and ePub downloads, according to the available data) and Abstracts Views on Vision4Press platform.
Data correspond to usage on the plateform after 2015. The current usage metrics is available 48-96 hours after online publication and is updated daily on week days.
Initial download of the metrics may take a while.