Open Access
Fig. C.1.
Download original image
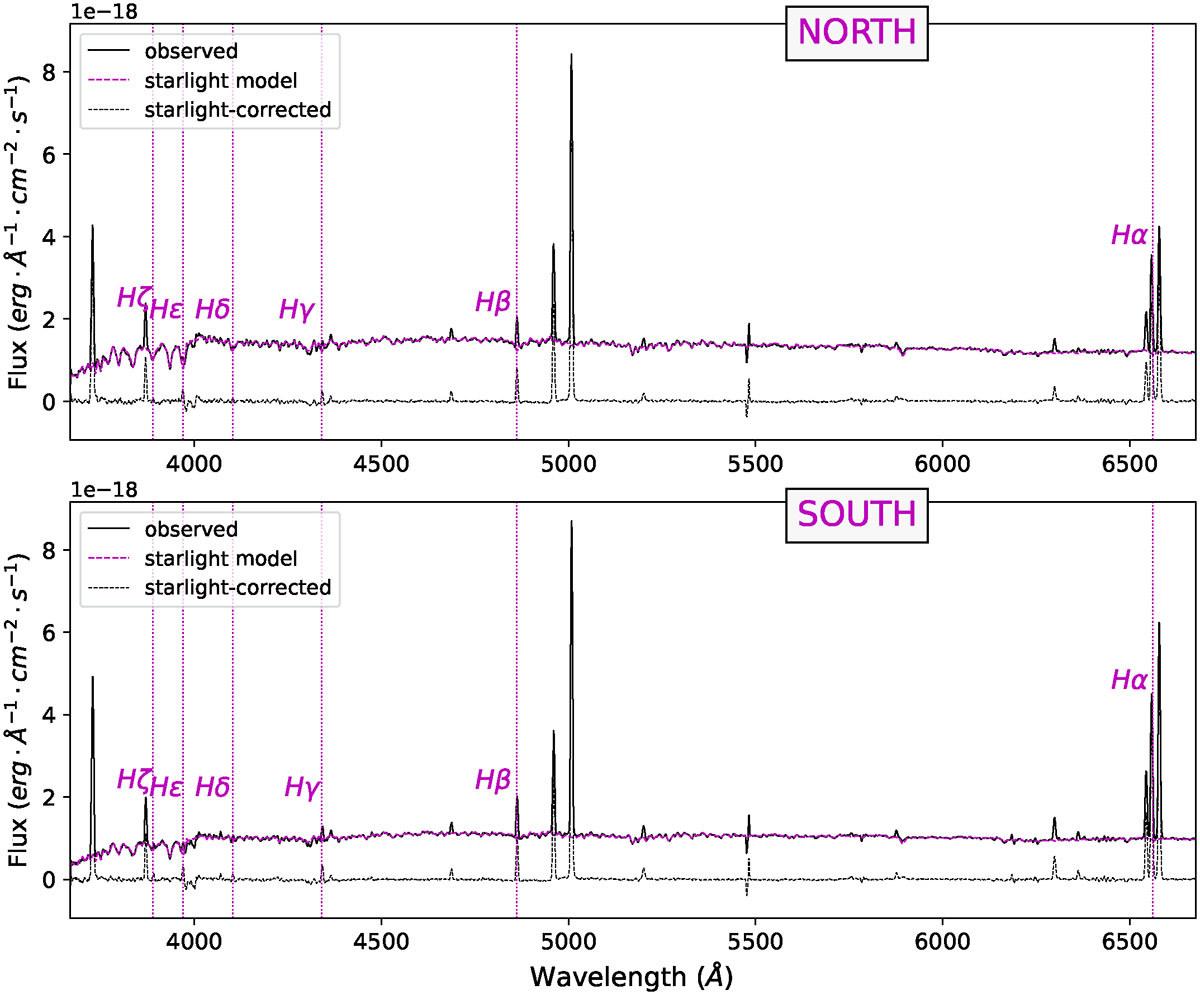
Direct spectra of the regions north and south of the nucleus of GSN 069 (both 1.25″extractions). The starlight model is represented in magenta. The starlight model has been subtracted from the observed spectrum to generate the starlight-corrected spectrum shown at the bottom of each panel with a dashed line.
Current usage metrics show cumulative count of Article Views (full-text article views including HTML views, PDF and ePub downloads, according to the available data) and Abstracts Views on Vision4Press platform.
Data correspond to usage on the plateform after 2015. The current usage metrics is available 48-96 hours after online publication and is updated daily on week days.
Initial download of the metrics may take a while.