Fig. 1
Download original image
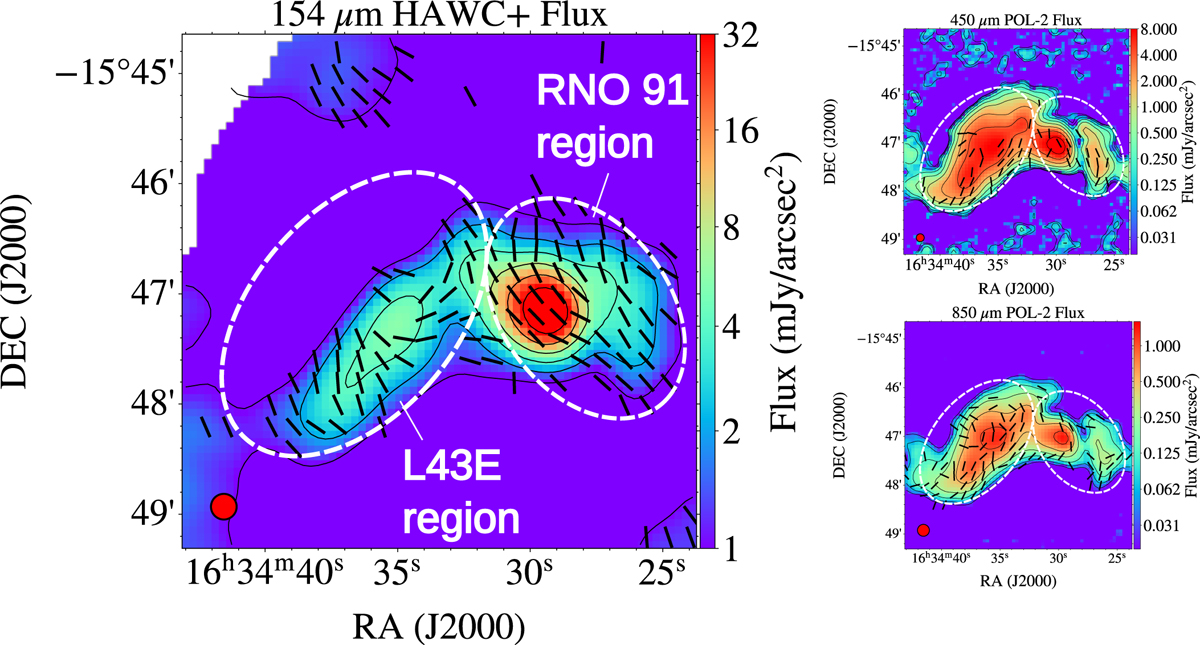
Dust continuum maps of the L43 region. Black lines indicate the polarization vectors. The vectors are rotated by 90° to indicate the magnetic field direction and are binned to the same 12″ grid. Black contour lines mark regions where the flux has doubled. White dashed ellipses show the two regions of interest that are referred to throughout this work. The effective beam size of each instrument is indicated with a red circle. Left: 154 μm continuum emission (SOFIA/HAWC+). Top right: 450 μm continuum emission (SCUBA-2/POL-2). Bottom right: 850 μm continuum emission (SCUBA-2/POL-2).
Current usage metrics show cumulative count of Article Views (full-text article views including HTML views, PDF and ePub downloads, according to the available data) and Abstracts Views on Vision4Press platform.
Data correspond to usage on the plateform after 2015. The current usage metrics is available 48-96 hours after online publication and is updated daily on week days.
Initial download of the metrics may take a while.