Fig. 2
Download original image
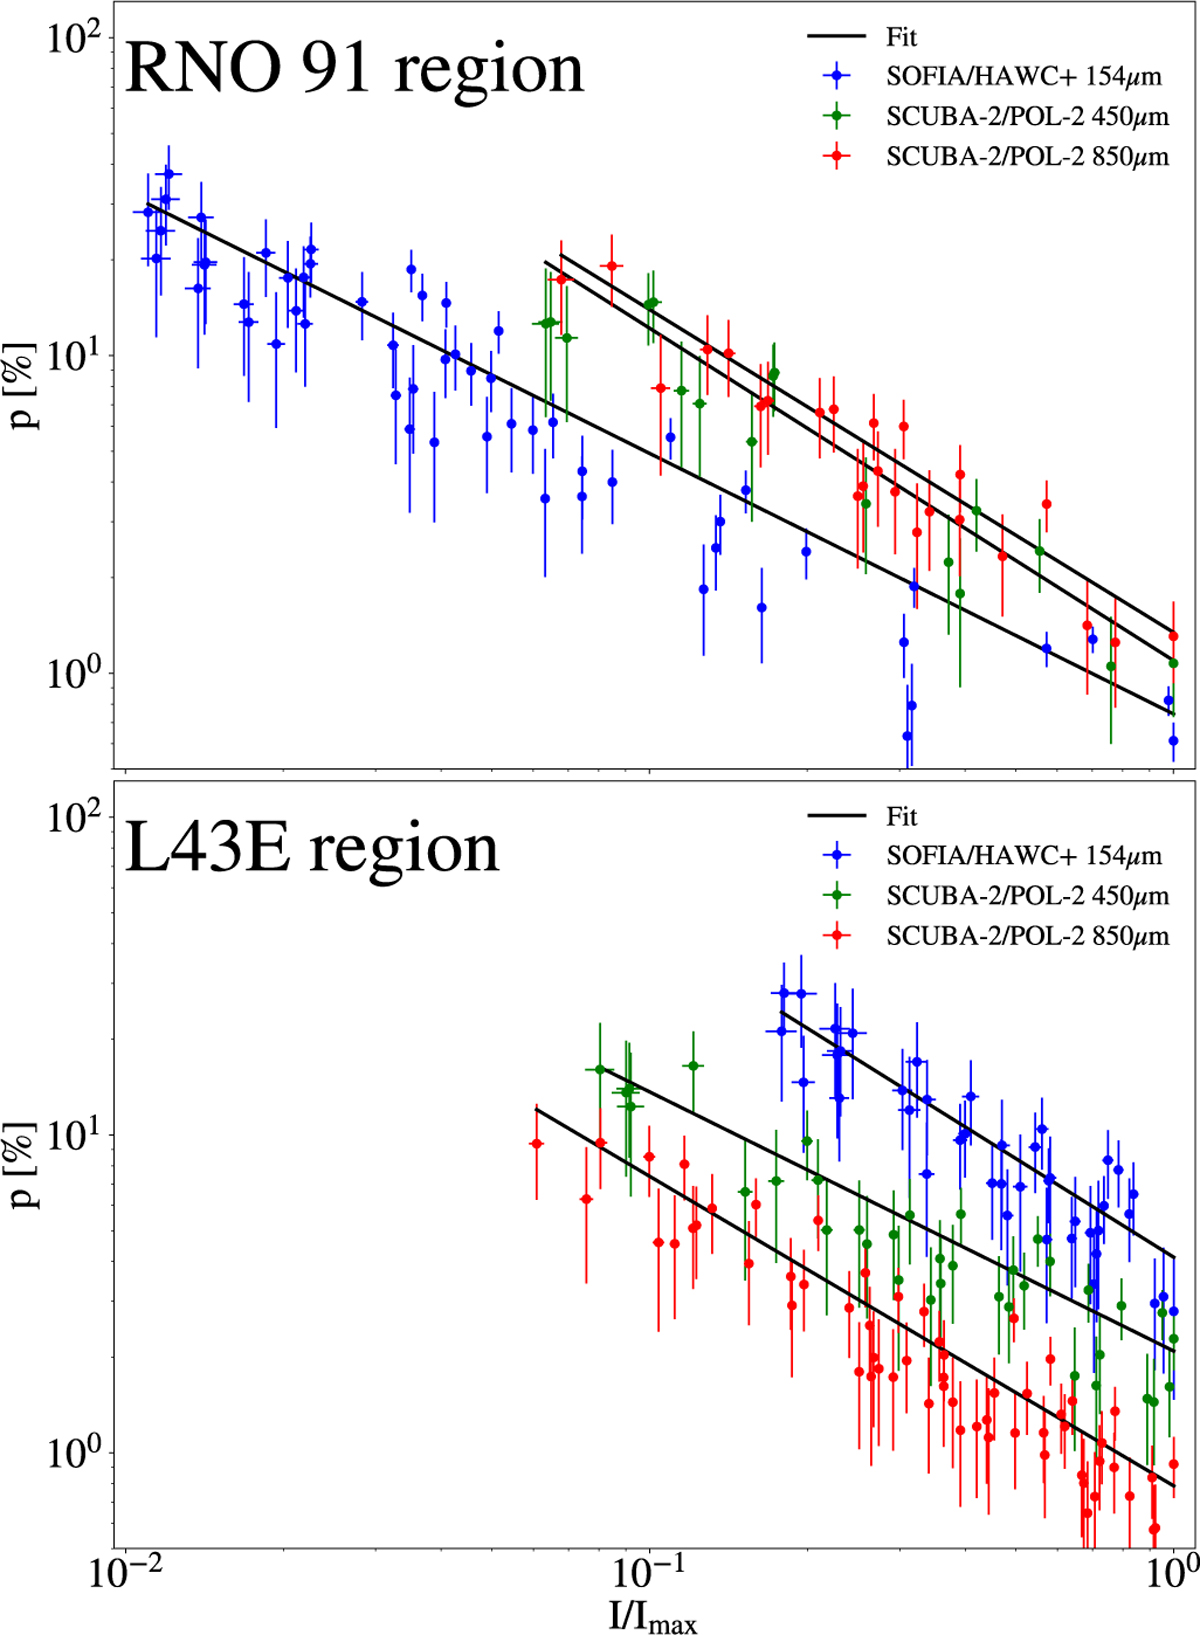
Degree of polarization as a function of the normalized intensity in the RNO 91 region (top panel) and the L43E region (bottom panel). The black lines indicate the best fit of Eq. (8) to each dataset. In the L43E region, we find ![]() (
(![]() ) at 154 μm,
) at 154 μm, ![]() (
(![]() ) at 450 μm and
) at 450 μm and![]() (
(![]() ) at 850 μm. In the RNO 91 region, we find
) at 850 μm. In the RNO 91 region, we find ![]() (
(![]() ) at 154 μm,
) at 154 μm, ![]() (
(![]() ) at 450 μm and
) at 450 μm and ![]() (
(![]() ) at 850 μm.
) at 850 μm.
Current usage metrics show cumulative count of Article Views (full-text article views including HTML views, PDF and ePub downloads, according to the available data) and Abstracts Views on Vision4Press platform.
Data correspond to usage on the plateform after 2015. The current usage metrics is available 48-96 hours after online publication and is updated daily on week days.
Initial download of the metrics may take a while.