Open Access
Fig. 3
Download original image
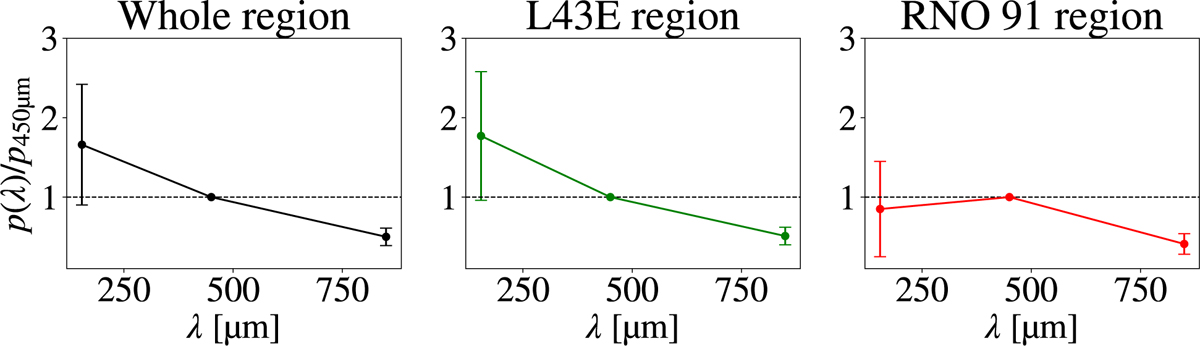
Global polarization spectra for the entire region (left panel), the L43E region (center panel), and the RNO 91 region (right panel). Points indicate the median, and error bars the MAD at a given wavelength. The spectra are normalized at λ0 = 450 μm. A black dashed line indicates unity.
Current usage metrics show cumulative count of Article Views (full-text article views including HTML views, PDF and ePub downloads, according to the available data) and Abstracts Views on Vision4Press platform.
Data correspond to usage on the plateform after 2015. The current usage metrics is available 48-96 hours after online publication and is updated daily on week days.
Initial download of the metrics may take a while.