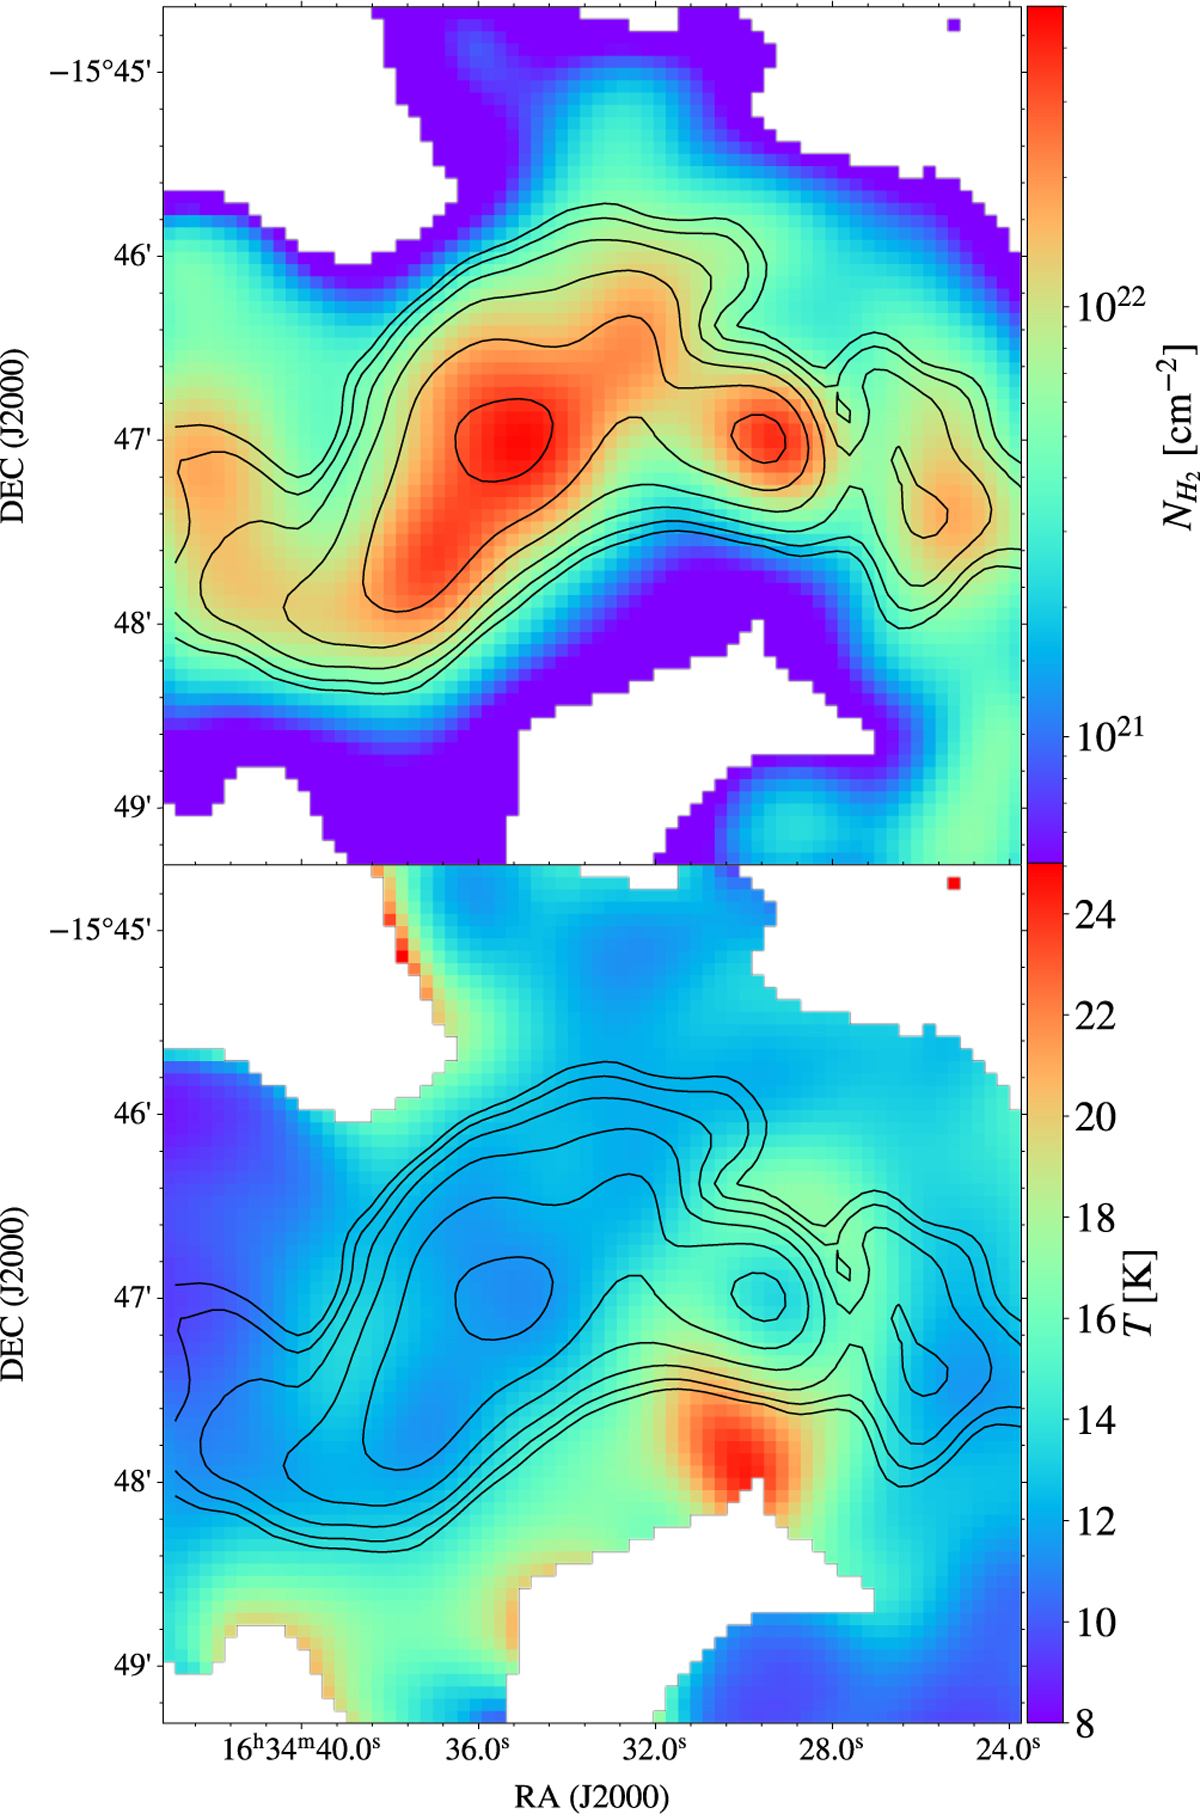
Fig. 4
Download original image
Spatially resolved column density (top panel) and LOS temperature (bottom panel) distributions, acquired by fitting Eq. (9) to Herschel PACS/SPIRE and JCMT/SCUBA-2 data at observing wavelengths of 160 μm, 250 μm, 350 μm, 500 μm, and 850 μm. Points where ∆Td > 5 K and NH2/ΔNH2 < 1 are excluded, where ∆Td and ∆NH2 refer to the errors on the respective fit parameter. Overlaid are contour lines of the 850 μm continuum emission from Fig. 1.
Current usage metrics show cumulative count of Article Views (full-text article views including HTML views, PDF and ePub downloads, according to the available data) and Abstracts Views on Vision4Press platform.
Data correspond to usage on the plateform after 2015. The current usage metrics is available 48-96 hours after online publication and is updated daily on week days.
Initial download of the metrics may take a while.