Fig. 6
Download original image
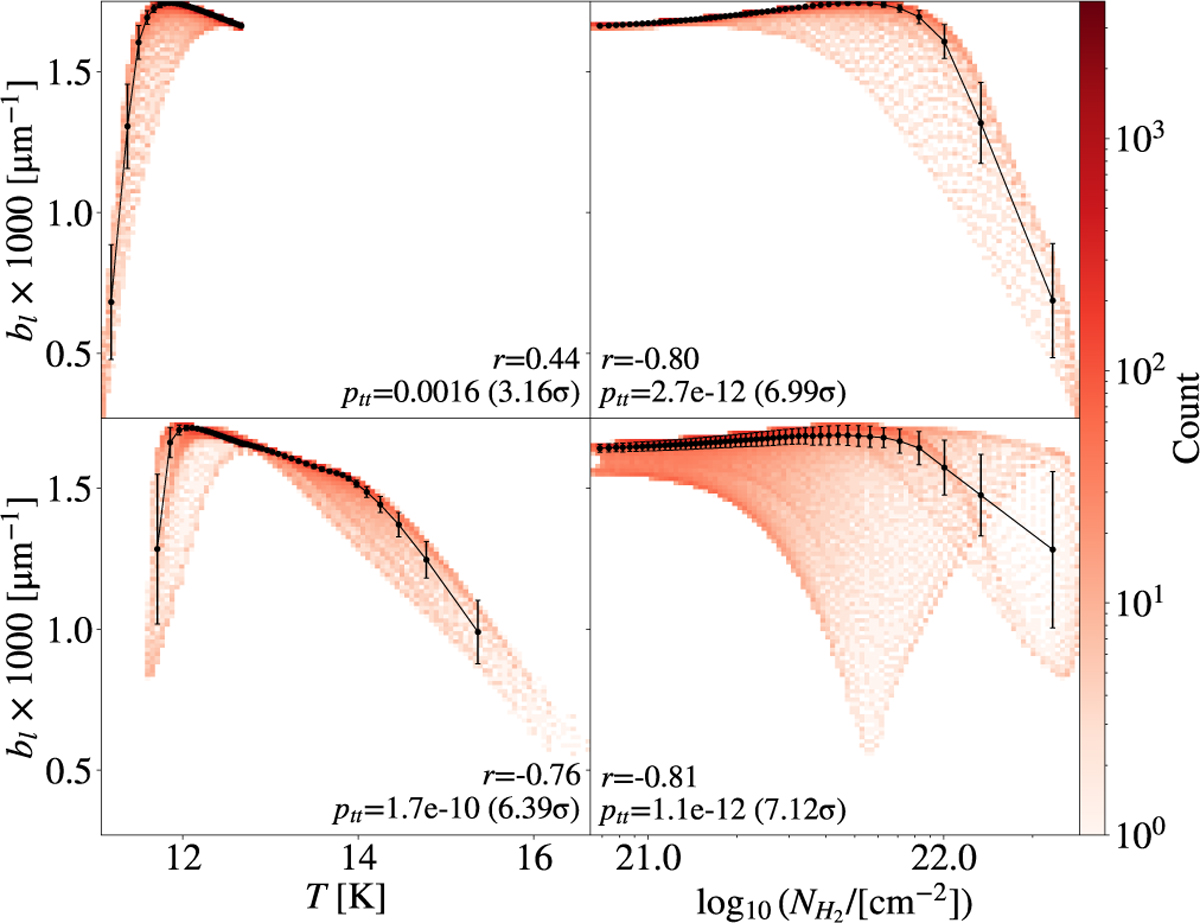
2D histograms of the effective slope bl of the normalized polarization spectrum, as a function of LOS temperature (left panels) and column density (right panels), respectively, colored by the count of data points in each bin. Top panels show results obtained with the ISRF as the only considered radiation source (Setup one), whereas bottom panels show results where the ISRF as well as an offset stellar source are considered (Setup two, see Sect. 5.1 for details). Pearson r, as well as two-tailed p values (ptt), are calculated from 50 segmented median values in each distribution.
Current usage metrics show cumulative count of Article Views (full-text article views including HTML views, PDF and ePub downloads, according to the available data) and Abstracts Views on Vision4Press platform.
Data correspond to usage on the plateform after 2015. The current usage metrics is available 48-96 hours after online publication and is updated daily on week days.
Initial download of the metrics may take a while.