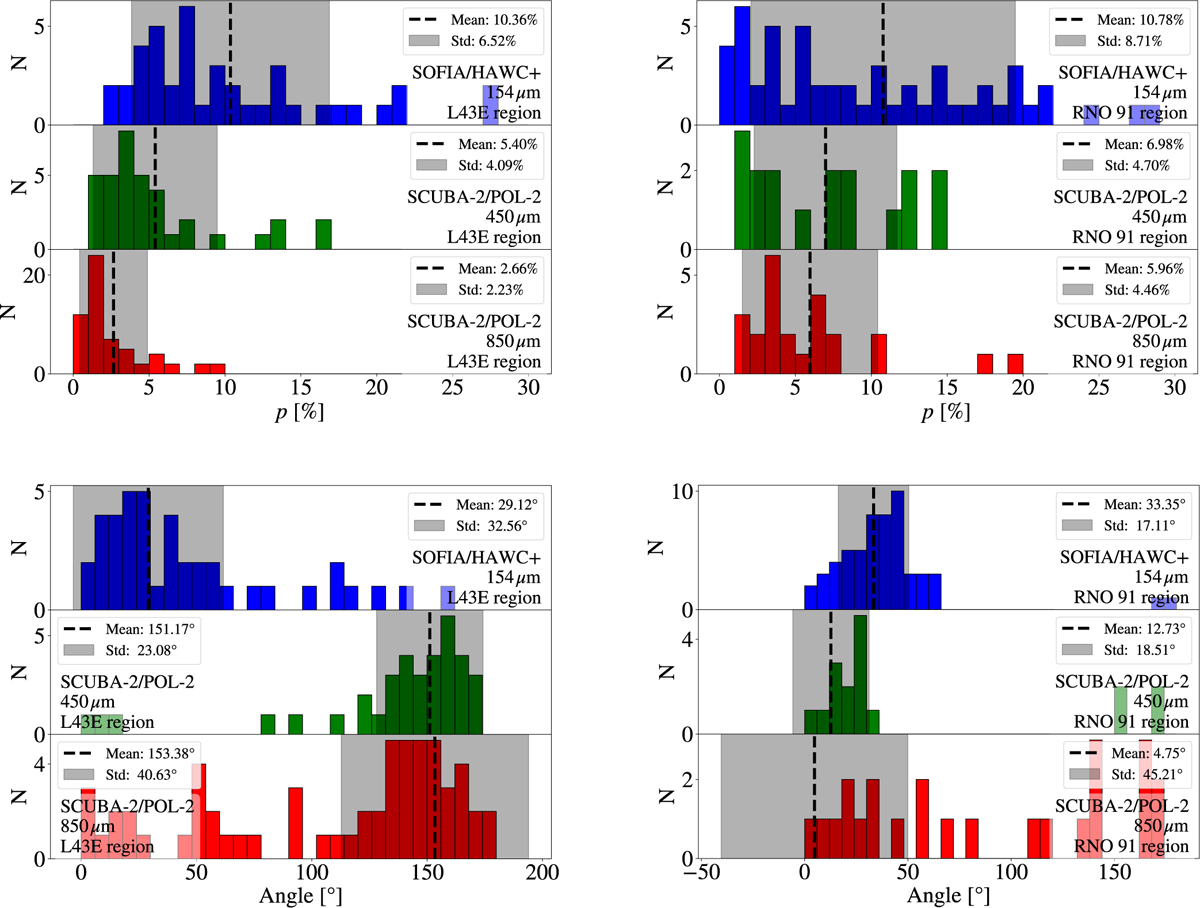
Fig. A.1
Download original image
Histograms of the degree of polarization (top panels) and the by 90° rotated polarization angles (bottom panels) for the three observing wavelengths at 154 μm (blue), 450 μm (green) and 850 μm (red). The dashed black line indicates the mean, and the gray shaded area the standard deviation of the distribution. Left panels: L43E region. Right panels: RNO 91 region.
Current usage metrics show cumulative count of Article Views (full-text article views including HTML views, PDF and ePub downloads, according to the available data) and Abstracts Views on Vision4Press platform.
Data correspond to usage on the plateform after 2015. The current usage metrics is available 48-96 hours after online publication and is updated daily on week days.
Initial download of the metrics may take a while.