Fig. 1
Download original image
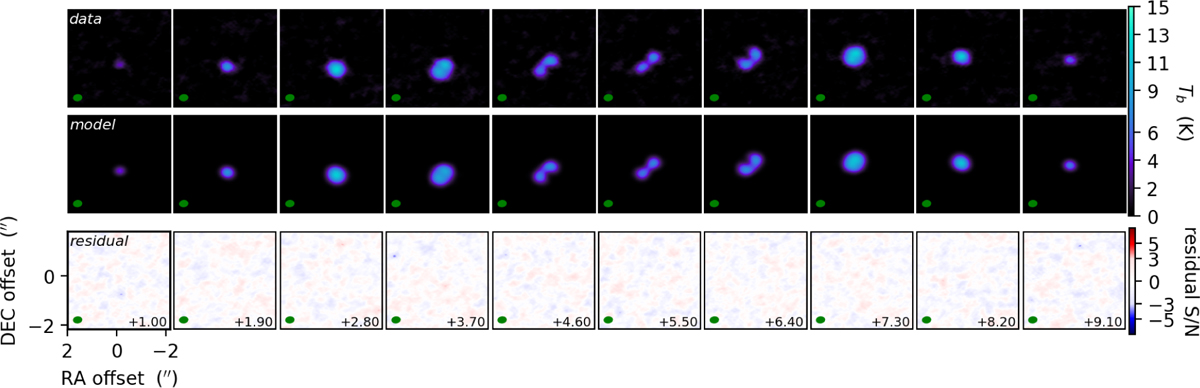
Residual plot for J16213469-2612269. In the first row, we show the channel maps of the data; in the second row, we show the channel maps of the best-fit model; in the third row, we show the channel maps of the residuals (data – model). The residual plots for all the disks analyzed in this work can be found in Appendix B and on GitHub4.
Current usage metrics show cumulative count of Article Views (full-text article views including HTML views, PDF and ePub downloads, according to the available data) and Abstracts Views on Vision4Press platform.
Data correspond to usage on the plateform after 2015. The current usage metrics is available 48-96 hours after online publication and is updated daily on week days.
Initial download of the metrics may take a while.