Fig. 4
Download original image
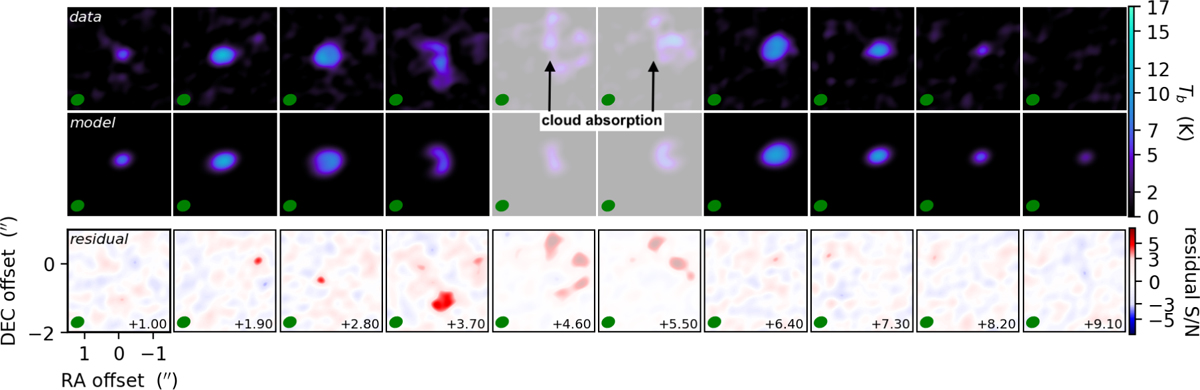
Residual plot for J16123916-1859284, shown in the same way as in Fig. 1. We highlight the residuals in the channel maps at v = 4.6, 5.5 km s−1, which are those affected by cloud absorption. Moreover, in the channel map at v = 3.7 km s−1, we show how csalt is able to separate the diffuse cloud emission (the localized red emission) and the Keplerian disk emission. The residual plots for all the disks analyzed in this work can be found in Appendix B and on GitHub4.
Current usage metrics show cumulative count of Article Views (full-text article views including HTML views, PDF and ePub downloads, according to the available data) and Abstracts Views on Vision4Press platform.
Data correspond to usage on the plateform after 2015. The current usage metrics is available 48-96 hours after online publication and is updated daily on week days.
Initial download of the metrics may take a while.