Fig. 3.
Download original image
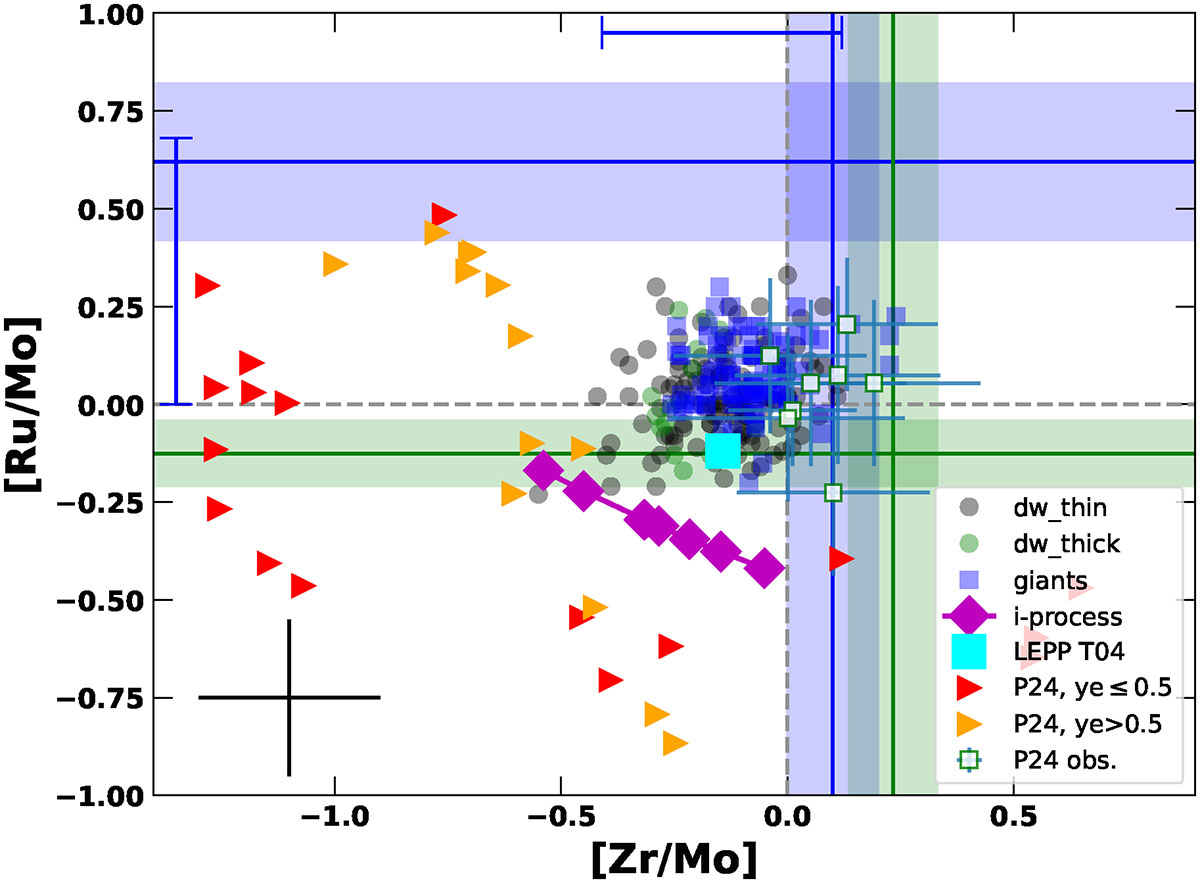
[Ru/Mo] for the stellar sample presented in this work, shown with respect to [Zr/Mo]. For comparison, the metal-poor stars from Honda et al. (2007), Hansen et al. (2012, 2014), Aoki et al. (2017) and Psaltis et al. (2024) are shown as white squares with green contours. The ratios from the s-process GCE simulations by Bisterzo et al. (2014) (green line and error range) and from the r-II star CS 22892-052 (Sneden et al. 2003) (green line and error range) are included as references. The production range derived from a collection of r-II stars is indicated by the blue horizontal and vertical error bars for [Zr/Mo] and [Ru/Mo], respectively (see the text for details). We also report the LEPP prediction by Travaglio et al. (2004) (large cyan square), the ratios from different neutrino-driven ejecta conditions in Psaltis et al. (2024) with Ye > 0.5 (orange triangles, νp-process) and with Ye < 0.5 (red squares, weak r-process), along with i-process predictions for mild neutron exposures, characterized by production peaking in the Zr–Ru region, and no relevant production at the Ba peak (magenta-lined squares; see text for more details). The typical observation error for our stars is given in the lower left corner of the plot (black error bar).
Current usage metrics show cumulative count of Article Views (full-text article views including HTML views, PDF and ePub downloads, according to the available data) and Abstracts Views on Vision4Press platform.
Data correspond to usage on the plateform after 2015. The current usage metrics is available 48-96 hours after online publication and is updated daily on week days.
Initial download of the metrics may take a while.