Fig. 3.
Download original image
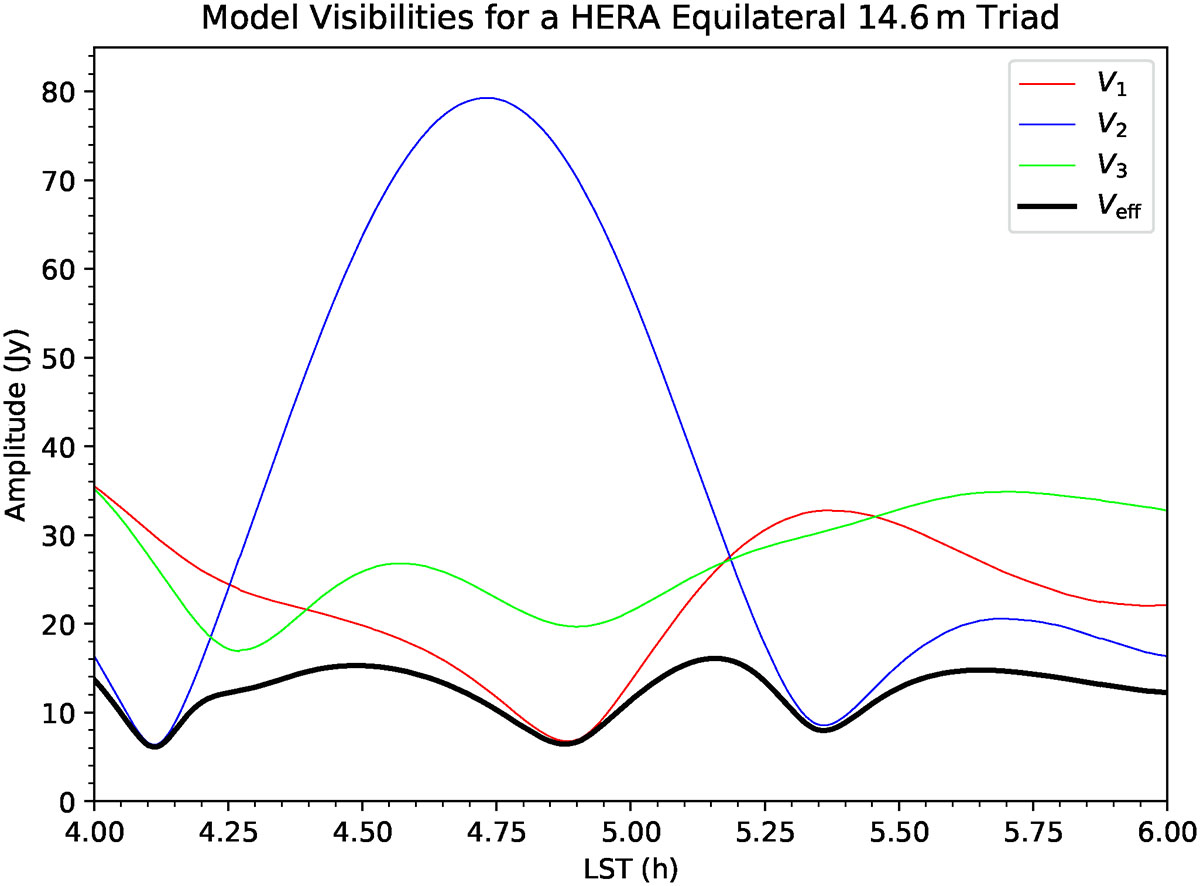
Model visibility amplitudes for a HERA equilateral 14.6 m triad (red, blue and green) as a function of local sidereal time (LST). The thick black line represents the effective visibility, Veff, which provides the scaling of the closure phase delay power spectrum. This example neglects the frequency dependence of the visibility amplitudes.
Current usage metrics show cumulative count of Article Views (full-text article views including HTML views, PDF and ePub downloads, according to the available data) and Abstracts Views on Vision4Press platform.
Data correspond to usage on the plateform after 2015. The current usage metrics is available 48-96 hours after online publication and is updated daily on week days.
Initial download of the metrics may take a while.