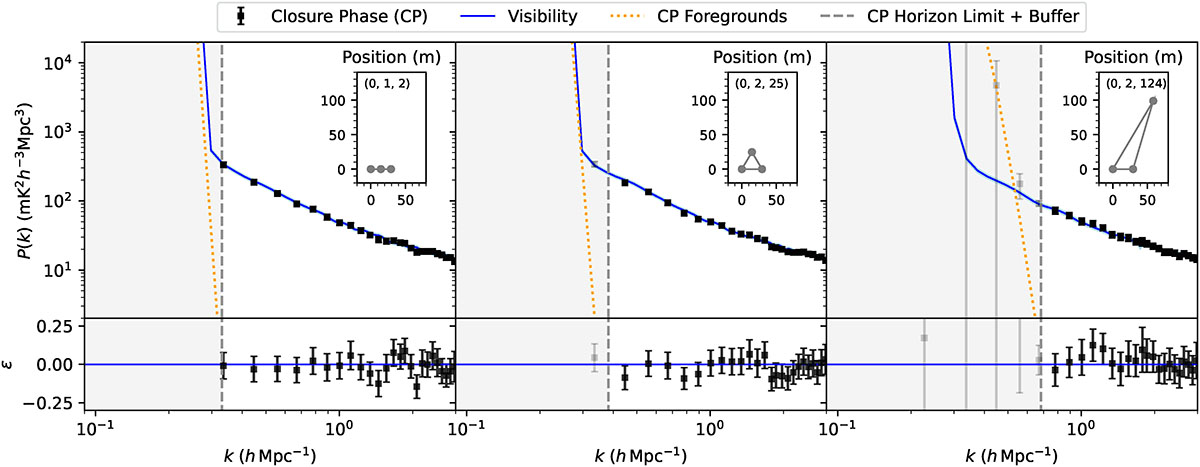
Fig. 6.
Download original image
Model 1 power spectrum estimates for three triads (see inserts). The top panel shows power spectra estimated from visibilities (solid blue line) and closure phases (black scatter points). The dotted orange line shows the closure phase power spectrum for a sky consisting of foregrounds only. The lower panel shows the fractional difference, ε, between the visibility and closure phase power spectra. The shaded regions mark the foreground wedge. All uncertainties due to cosmic variance are 2σ.
Current usage metrics show cumulative count of Article Views (full-text article views including HTML views, PDF and ePub downloads, according to the available data) and Abstracts Views on Vision4Press platform.
Data correspond to usage on the plateform after 2015. The current usage metrics is available 48-96 hours after online publication and is updated daily on week days.
Initial download of the metrics may take a while.