Open Access
Fig. 7.
Download original image
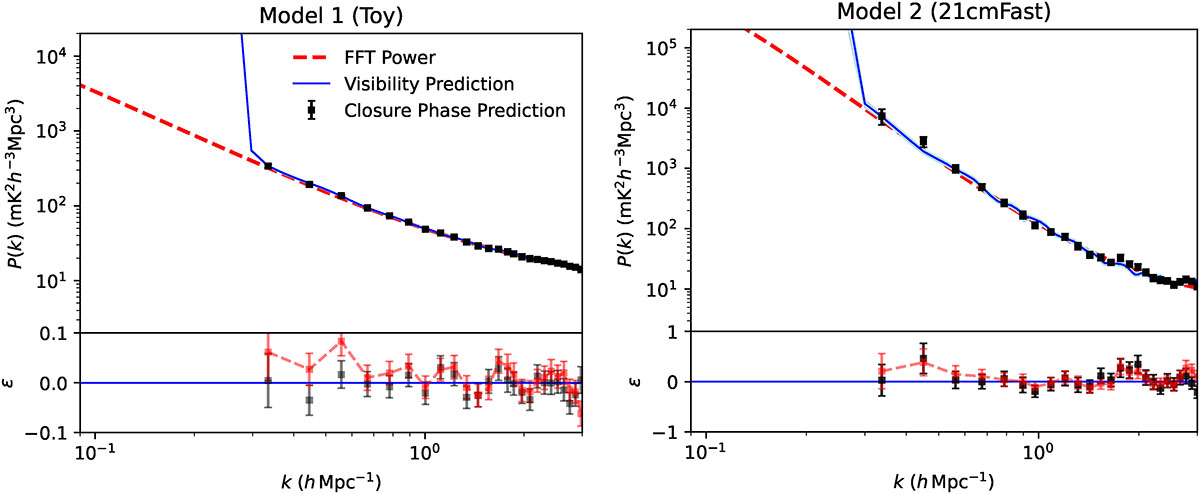
Same as Figure 6 but averaged across all 15 triads in bins of k. The left and right plots show the estimated power spectra for Model 1 and Model 2, respectively. The red dashed line shows the power spectrum obtained from doing a 3D FFT on the full resolution cubes.
Current usage metrics show cumulative count of Article Views (full-text article views including HTML views, PDF and ePub downloads, according to the available data) and Abstracts Views on Vision4Press platform.
Data correspond to usage on the plateform after 2015. The current usage metrics is available 48-96 hours after online publication and is updated daily on week days.
Initial download of the metrics may take a while.