Fig. 3
Download original image
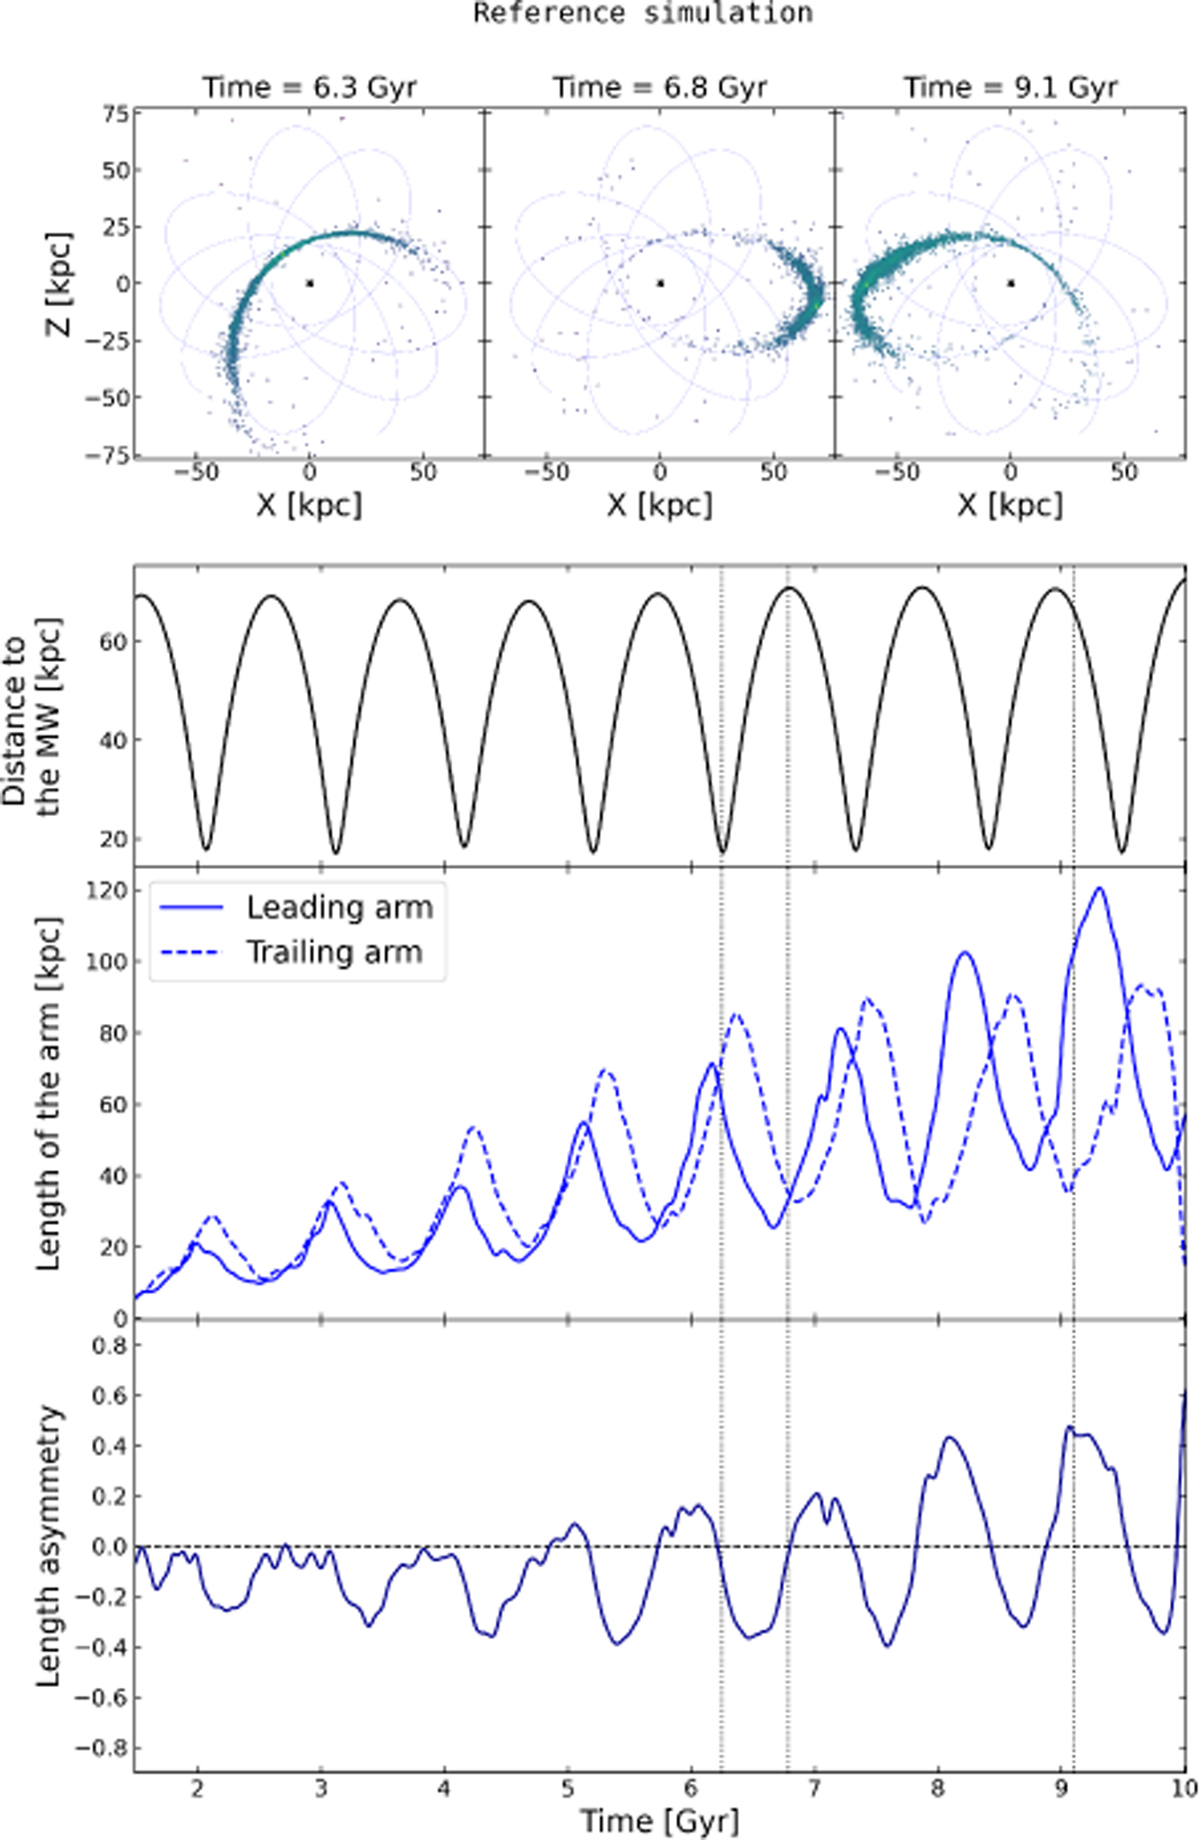
First row : three snapshots of one stream in the reference simulation, shown at the progenitor’s pericentre, apocentre, and at a time when the length asymmetry reaches one of its maxima. The black cross marks the Milky Way’s centre of mass and the blue line the progenitor’s trajectory. Second row : time evolution of the progenitor’s distance to the Milky Way’s centre of mass. Third row : time evolution of the length of the leading and trailing arm. Fourth row : normalised asymmetry between the leading and trailing arm lengths. The three vertical dotted lines mark the times of the snapshots shown in the top row. All time-dependent curves are smoothed with a 1D Gaussian filter with σ = 2.
Current usage metrics show cumulative count of Article Views (full-text article views including HTML views, PDF and ePub downloads, according to the available data) and Abstracts Views on Vision4Press platform.
Data correspond to usage on the plateform after 2015. The current usage metrics is available 48-96 hours after online publication and is updated daily on week days.
Initial download of the metrics may take a while.