Open Access
Fig. 5
Download original image
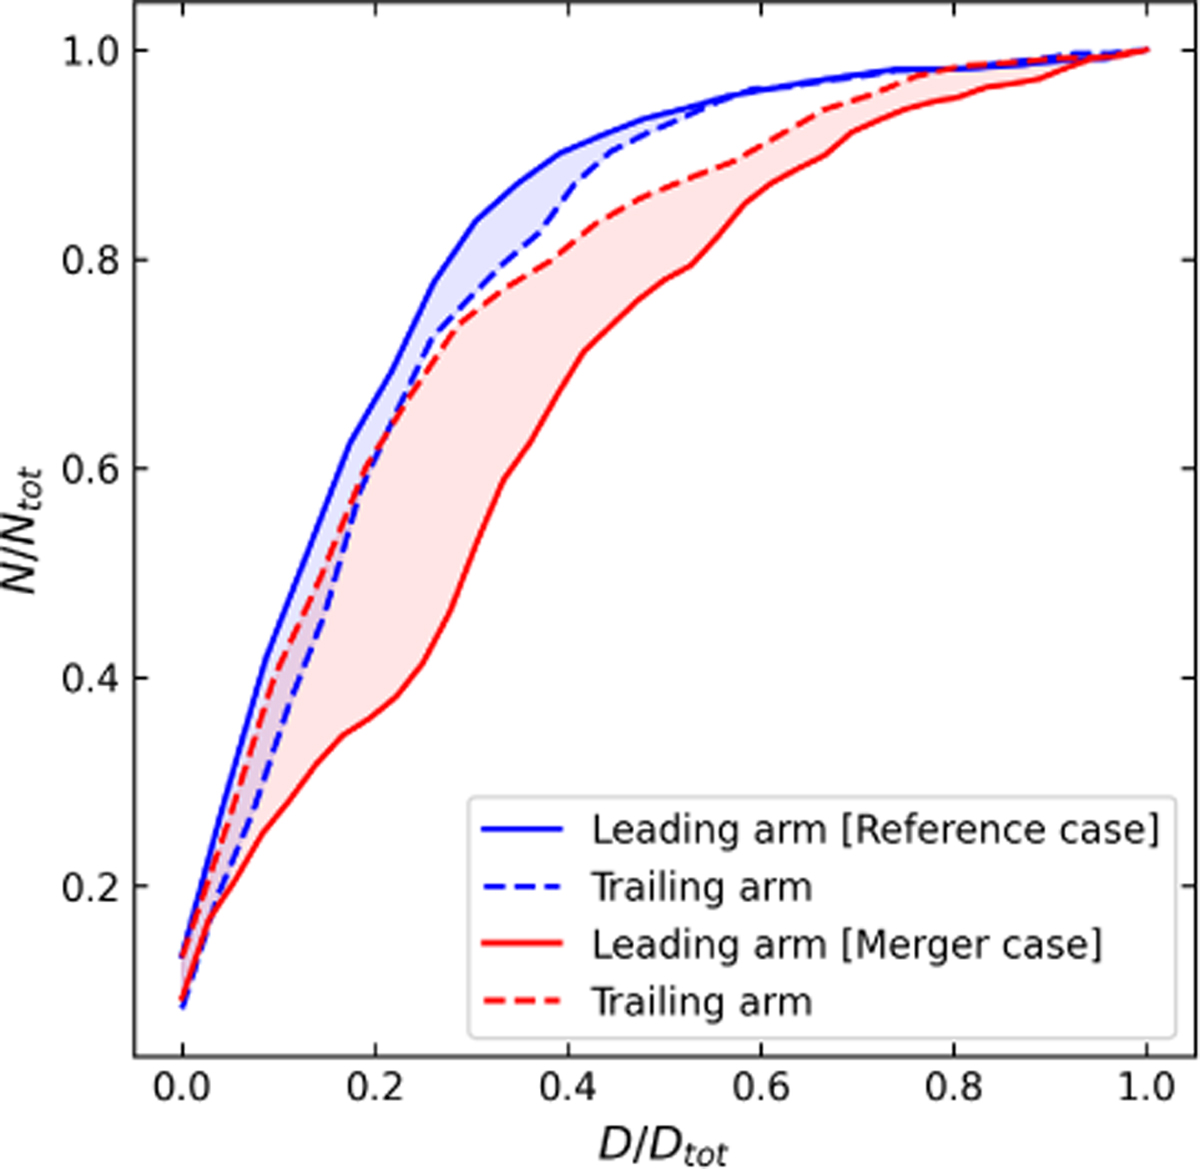
Normalised cumulative fraction of particles along the leading (solid) and trailing (dashed) arms of the same stream shown in Fig. 2, computed from 2 kpc outwards from the progenitor. Blue curves correspond to the reference simulation and red curves to the merger simulation.
Current usage metrics show cumulative count of Article Views (full-text article views including HTML views, PDF and ePub downloads, according to the available data) and Abstracts Views on Vision4Press platform.
Data correspond to usage on the plateform after 2015. The current usage metrics is available 48-96 hours after online publication and is updated daily on week days.
Initial download of the metrics may take a while.