Fig. 6
Download original image
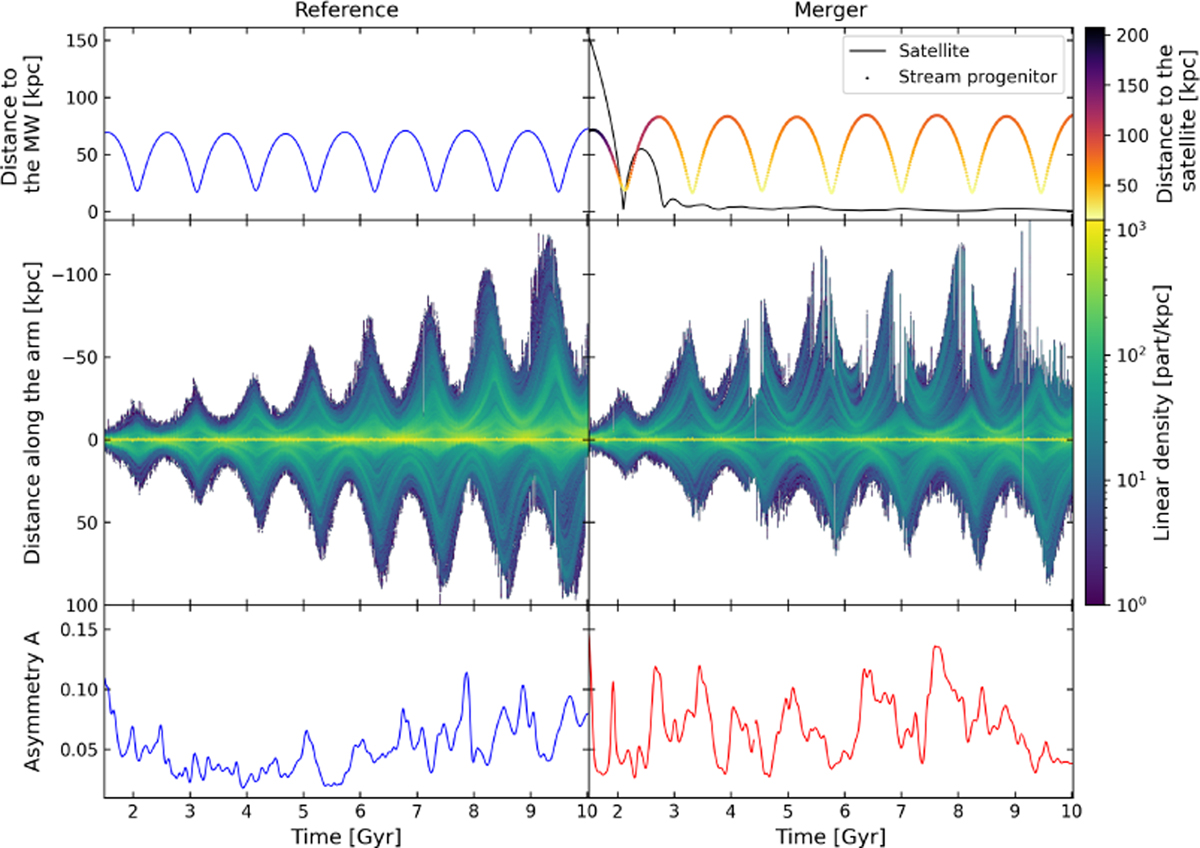
Time evolution of a single stellar stream from our simulations. The left column shows the reference run and the right column shows the merger run. Top panel : distance of the stream progenitor to the Milky Way’s centre of mass as a function of time. In the merger case, each point is colour-coded by the progenitor’s distance to the satellite, and the satellite’s own orbital radius around the Milky Way is overplotted in black. Middle panel : evolution of the density profile along the stream (zero at the progenitor; negative values denote the leading arm, positive values the trailing arm). Bottom panel : evolution of the stream asymmetry, defined as the sum of the absolute difference between the two cumulative density profiles of the leading and trailing arms (Eq. (4)).
Current usage metrics show cumulative count of Article Views (full-text article views including HTML views, PDF and ePub downloads, according to the available data) and Abstracts Views on Vision4Press platform.
Data correspond to usage on the plateform after 2015. The current usage metrics is available 48-96 hours after online publication and is updated daily on week days.
Initial download of the metrics may take a while.