Fig. 7
Download original image
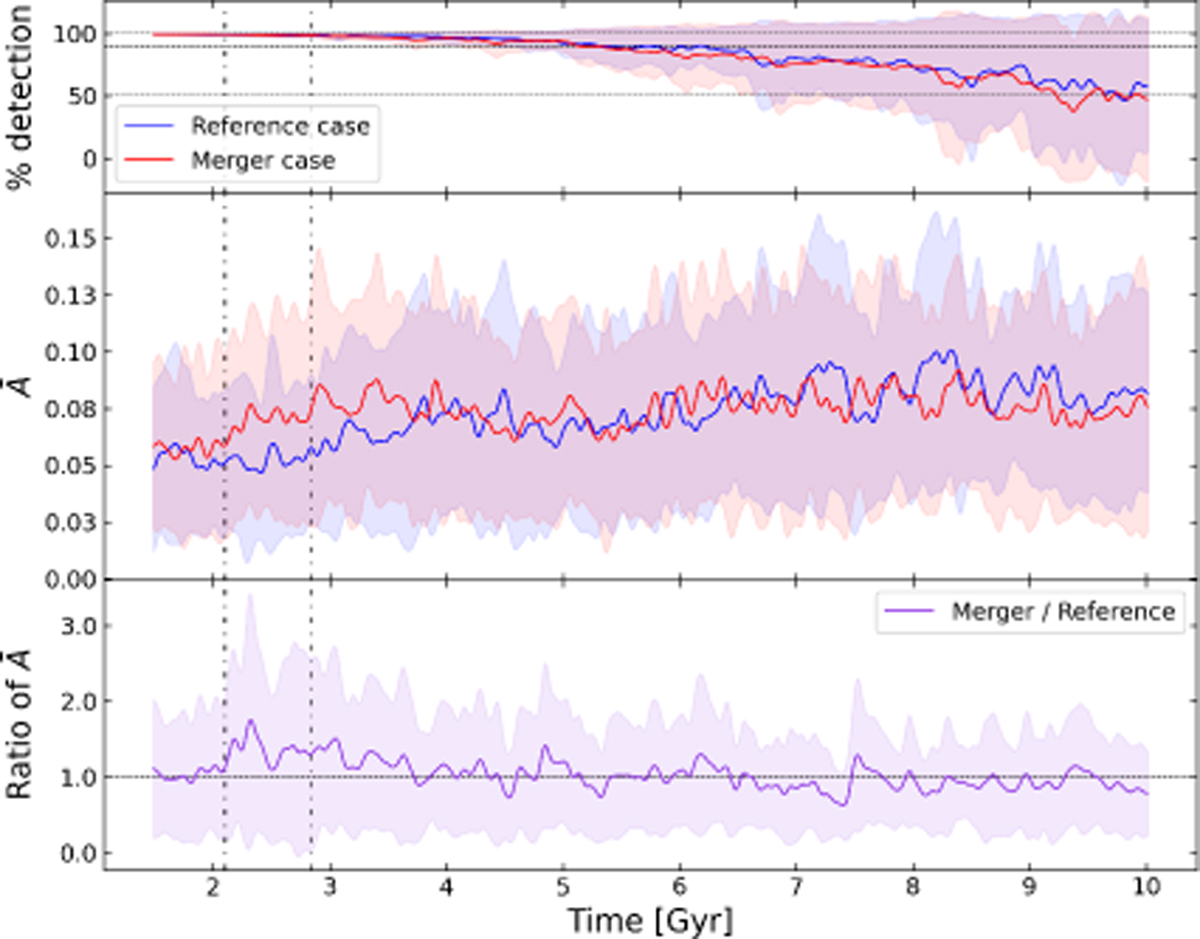
Top panel : fraction of stream particles recovered by the 1-DREAM algorithm as a function of time. Middle row : median asymmetry between the leading and trailing arms versus time. Bottom panel: ratio of the median asymmetry in the merger case to that in the reference case. Shaded envelopes indicate the ±1σ robust standard deviation.
Current usage metrics show cumulative count of Article Views (full-text article views including HTML views, PDF and ePub downloads, according to the available data) and Abstracts Views on Vision4Press platform.
Data correspond to usage on the plateform after 2015. The current usage metrics is available 48-96 hours after online publication and is updated daily on week days.
Initial download of the metrics may take a while.