Fig. 10
Download original image
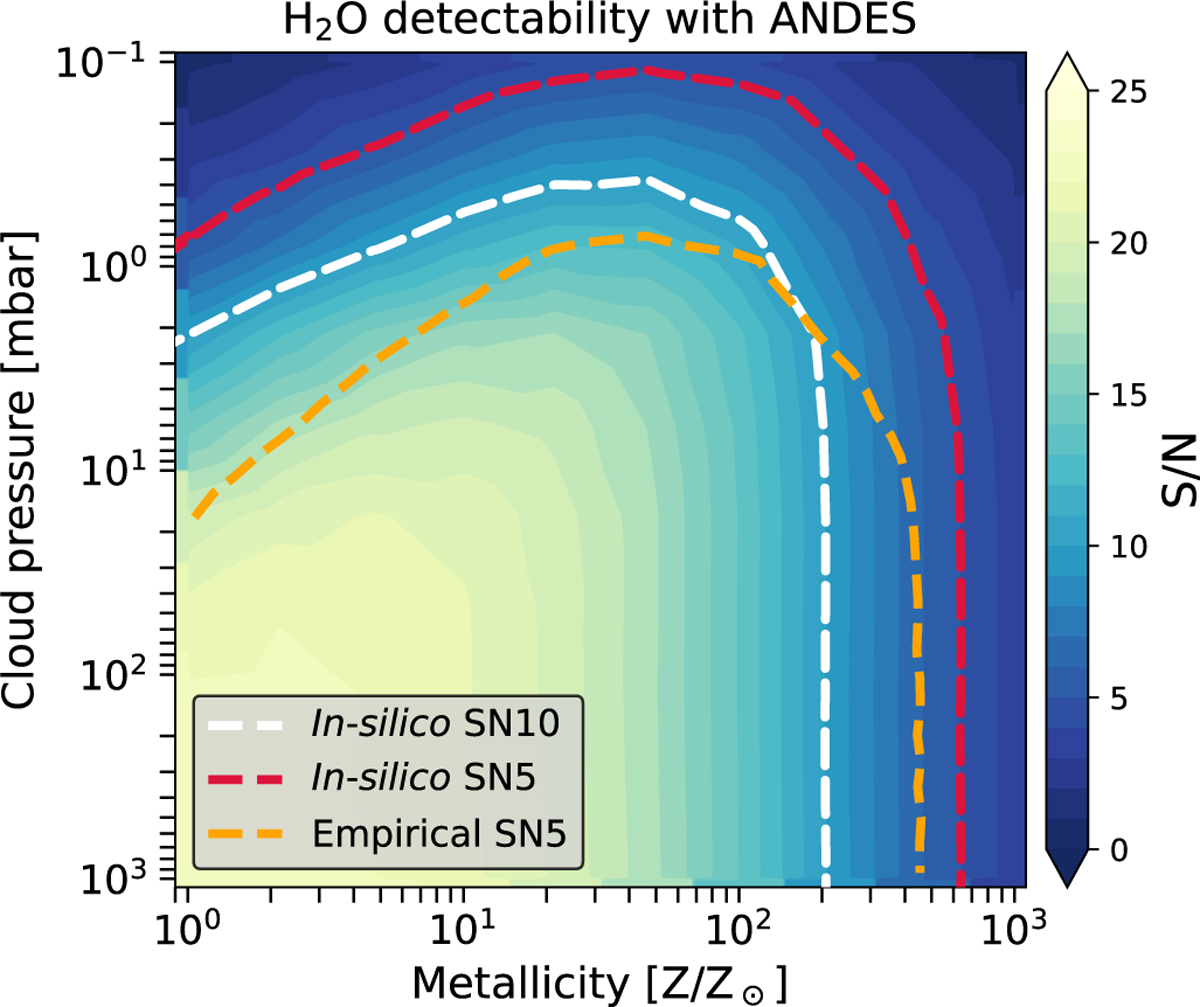
Simulated H2O detectability map for GJ 436 b produced with EXoPLORE assuming a single transit observed with ANDES. The white and red contours indicate recovered S/N levels of 10 and 5 with in-silico data, respectively. To illustrate the improvement over current constraints, we show the S/N = 5 contour (orange curve) derived from combining the CARMENES and CRIRES+ data (Fig. 8). Although based on simulations, the map illustrates the significant improvement in sensitivity that ANDES and the ELT are expected to provide for probing cloudy sub-Neptune atmospheres.
Current usage metrics show cumulative count of Article Views (full-text article views including HTML views, PDF and ePub downloads, according to the available data) and Abstracts Views on Vision4Press platform.
Data correspond to usage on the plateform after 2015. The current usage metrics is available 48-96 hours after online publication and is updated daily on week days.
Initial download of the metrics may take a while.