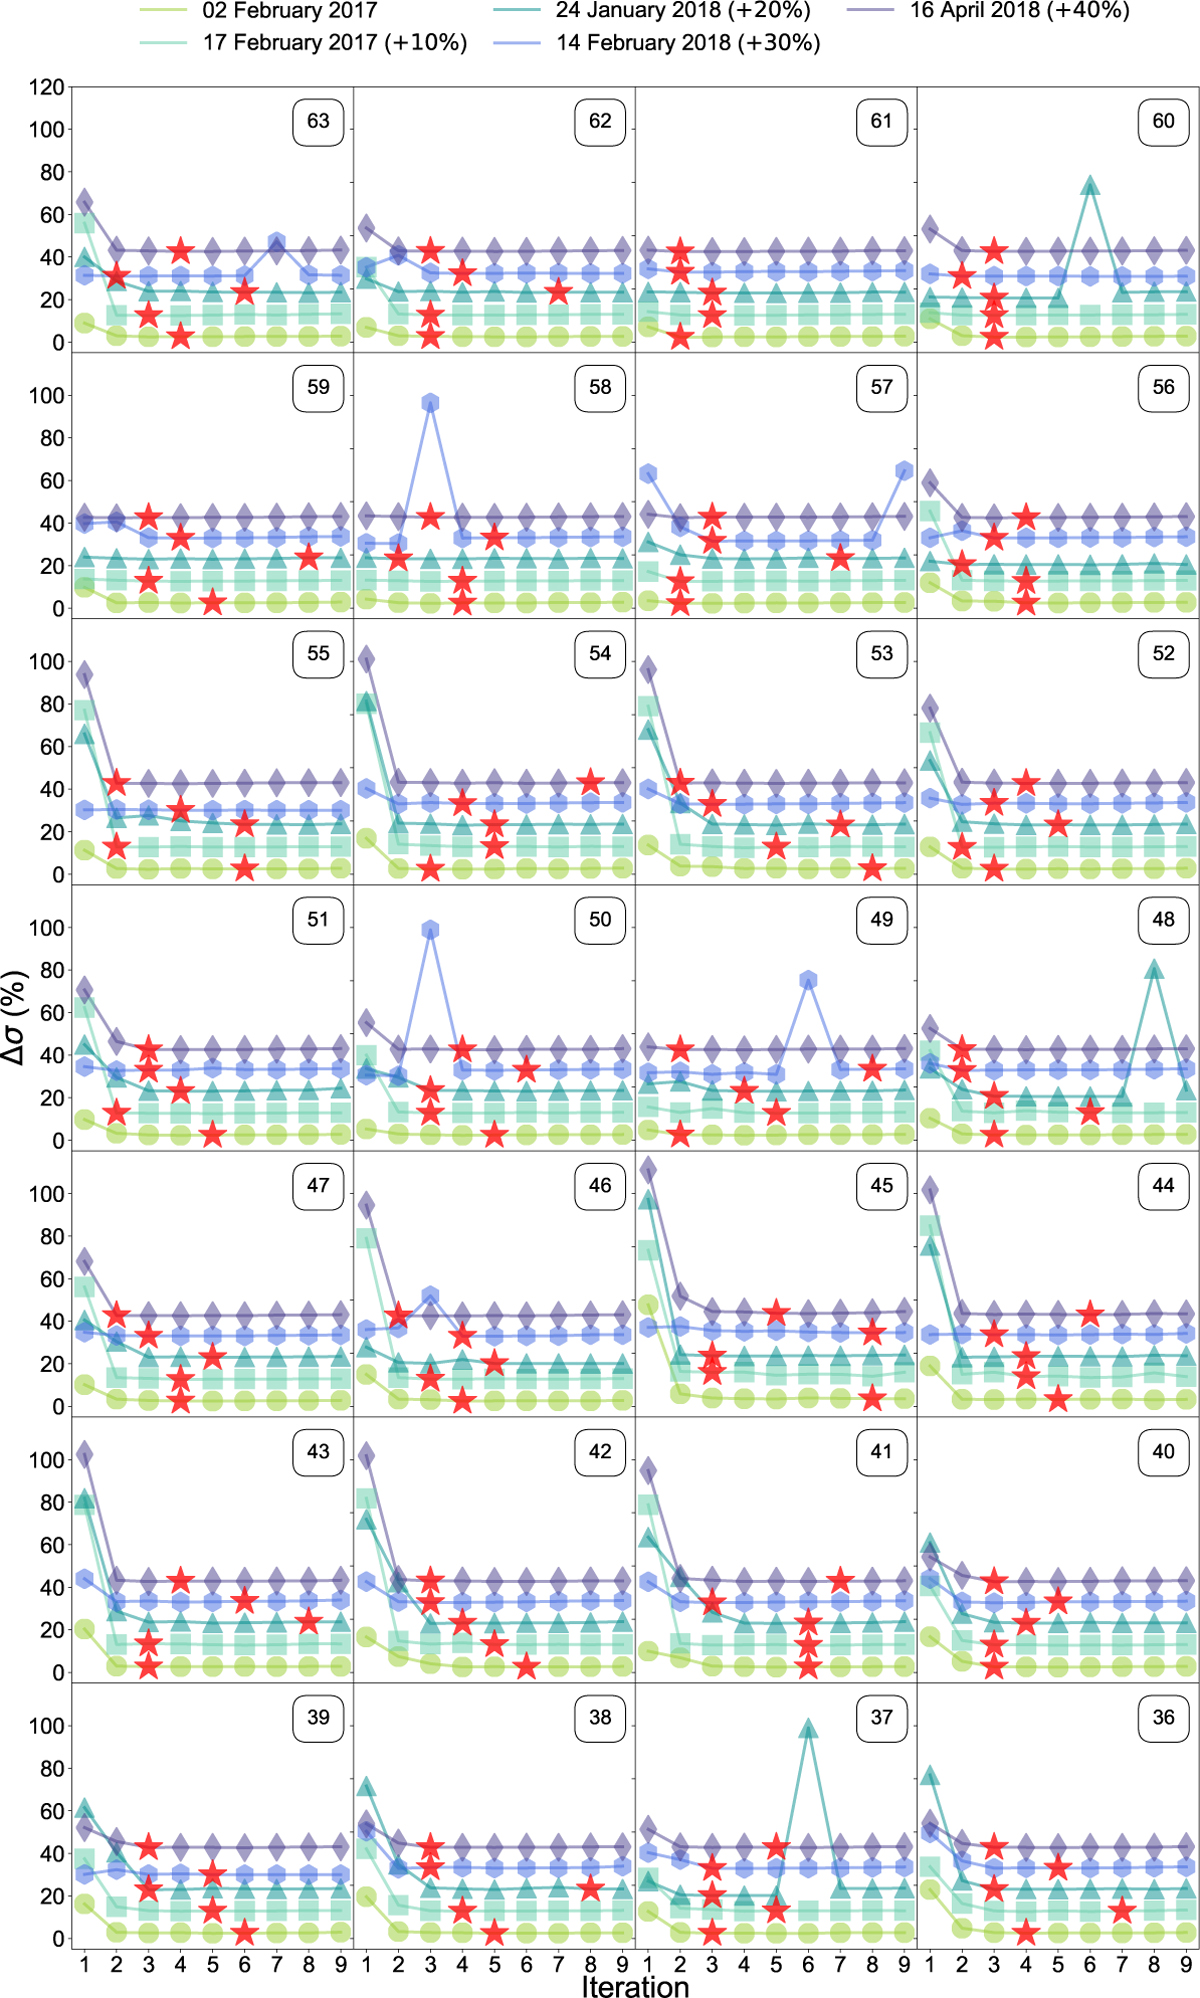
Fig. A.7
Download original image
Illustration of the selection criterion used for order-wise SysRem optimization for the CARMENES datasets. Here, the values of ∆σ (vertical axis) are plotted as a function of the SysRem pass (horizontal axis) across all spectral orders for observations from all five nights. Red stars mark the SysRem pass at which a plateau is reached, indicating the point at which the algorithm is halted. Spectral order number is indicated in the upper right corner of each cell. For clarity, an offset was added to the per-night curves, as indicated in the legend.
Current usage metrics show cumulative count of Article Views (full-text article views including HTML views, PDF and ePub downloads, according to the available data) and Abstracts Views on Vision4Press platform.
Data correspond to usage on the plateform after 2015. The current usage metrics is available 48-96 hours after online publication and is updated daily on week days.
Initial download of the metrics may take a while.