Fig. A.11
Download original image
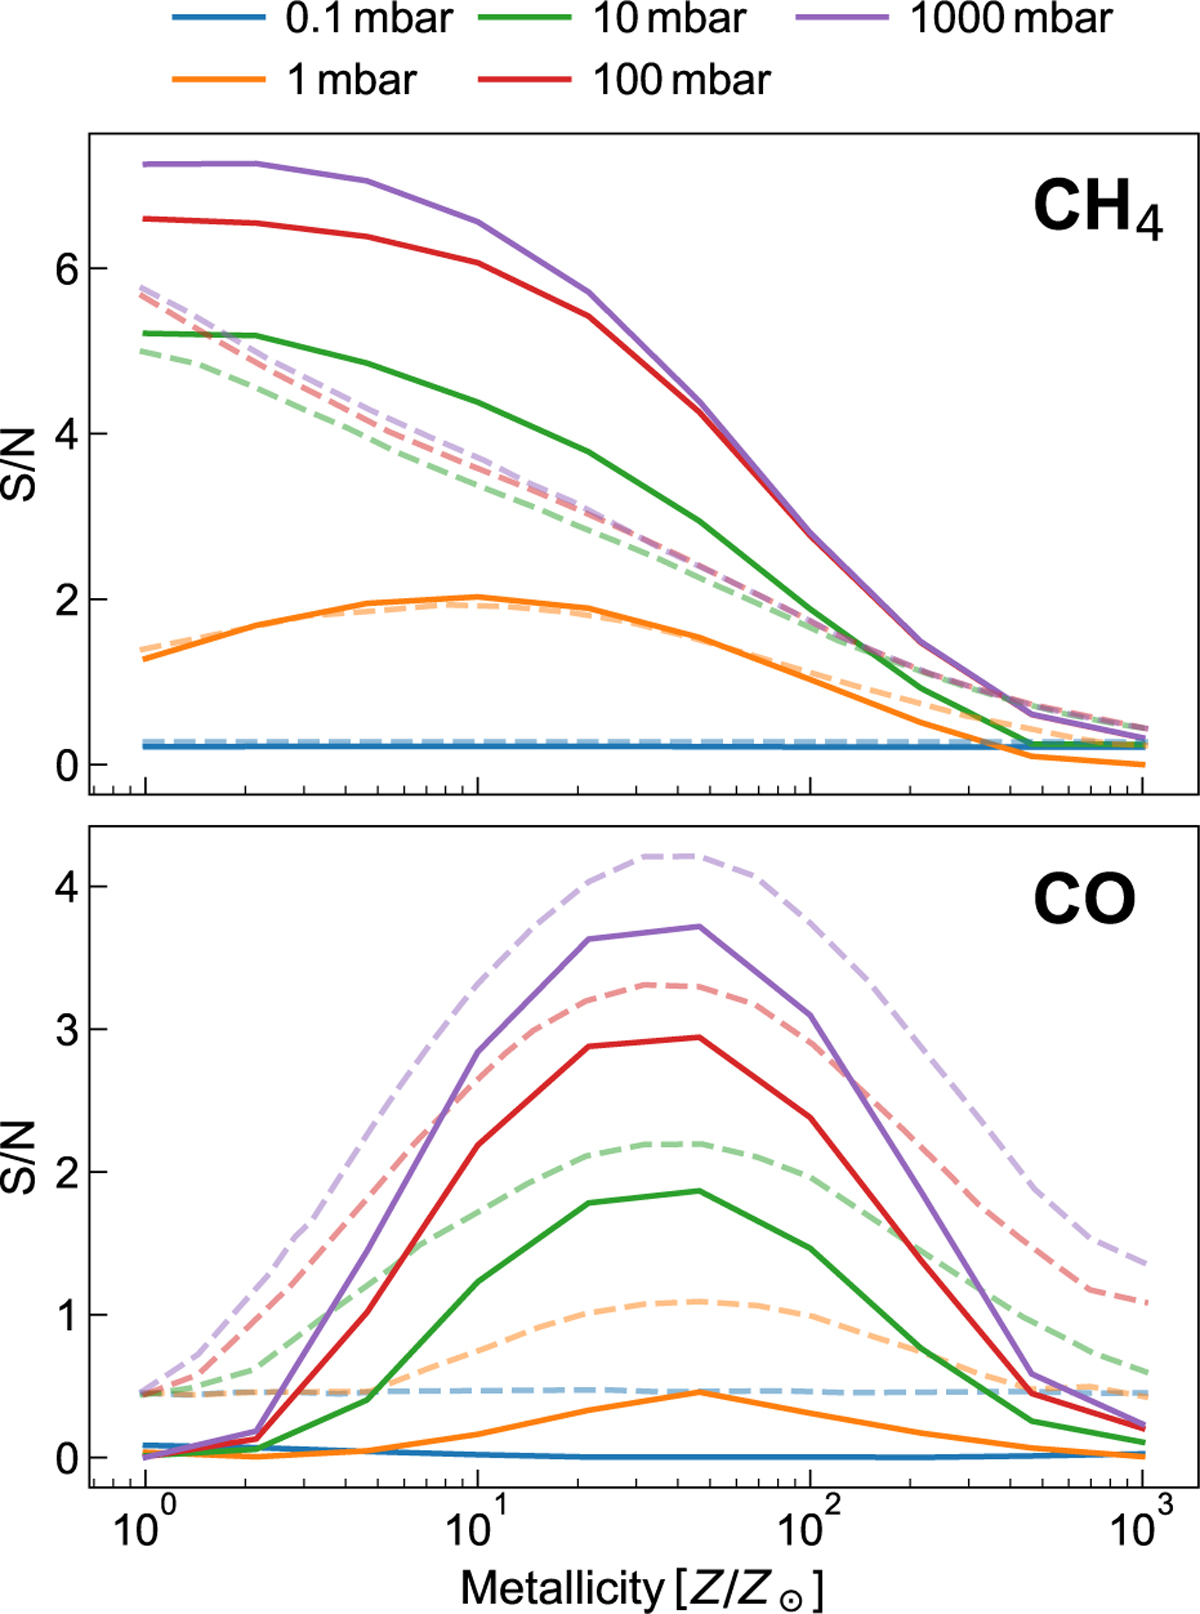
S/N slices from Fig. 8 showing the S/N (vertical axis) as a function of the injected-model metallicity (horizontal axis). In the top panel, we show this result for CH4, and CO is shown in the bottom panel. Different colours correspond to the different fixed pc. Dashed lines correspond to S/N slices at the same fixed pc from Fig. 6 of Grasser et al. (2024). Due to the unavailability of the original data, these values were extracted using WebPlotDigitizer (Version 5.2).
Current usage metrics show cumulative count of Article Views (full-text article views including HTML views, PDF and ePub downloads, according to the available data) and Abstracts Views on Vision4Press platform.
Data correspond to usage on the plateform after 2015. The current usage metrics is available 48-96 hours after online publication and is updated daily on week days.
Initial download of the metrics may take a while.