Fig. 4
Download original image
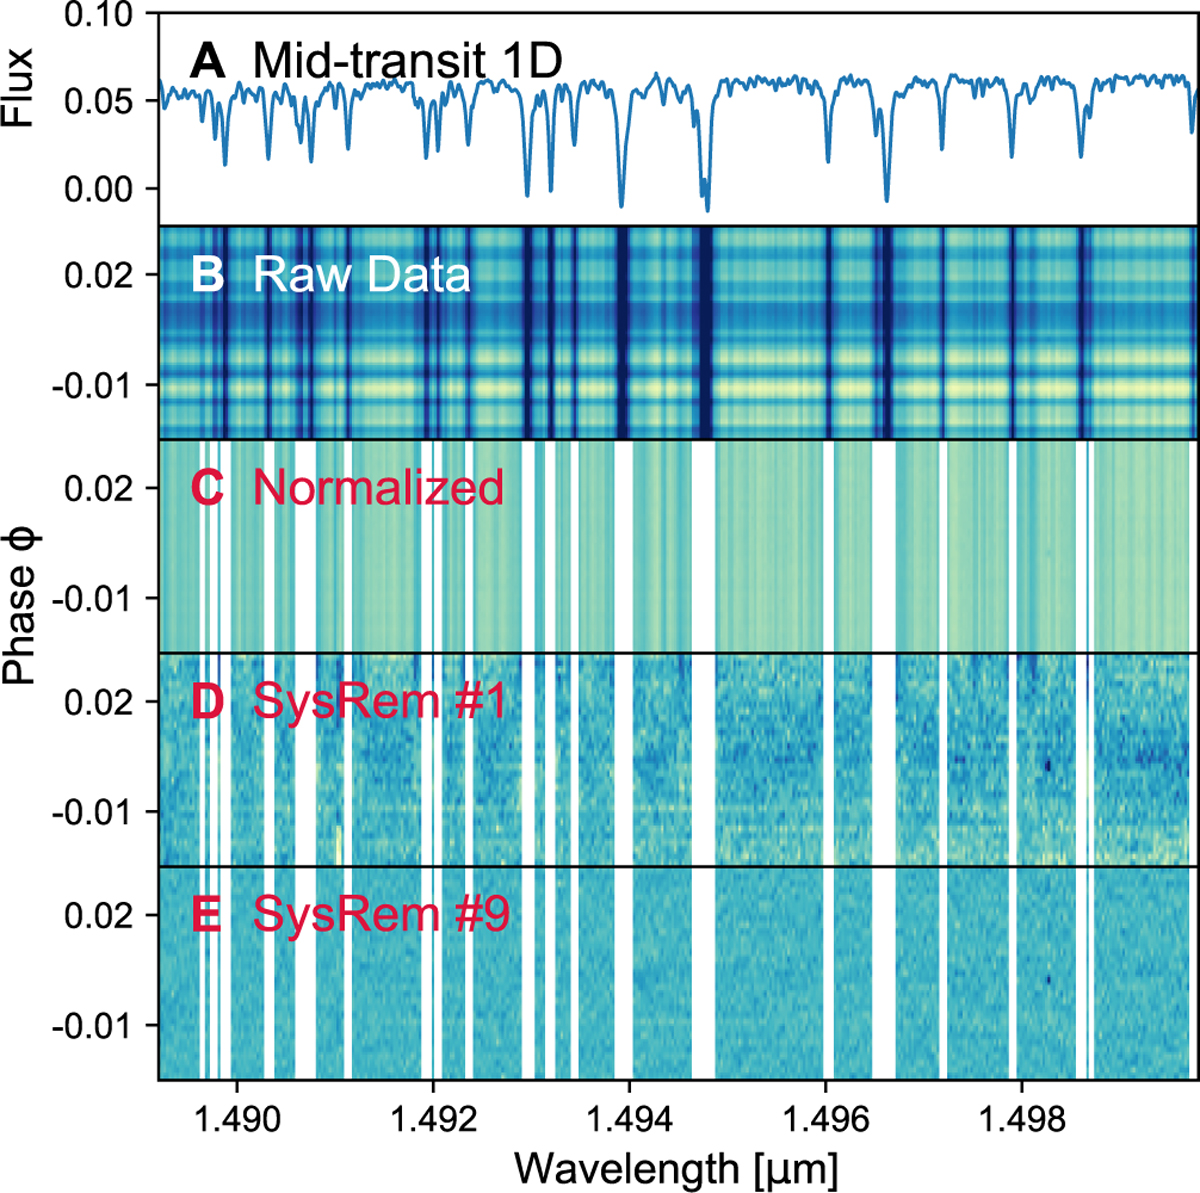
Steps of the data preparation applied to a representative spectral region of the dataset obtained on the night of February 04, 2017. The vertical axis in panel A represents flux in arbitrary units, while in all other panels it represents time, expressed as phase. Panel A: original spectrum observed at mid-transit, where telluric absorption lines from H2O can be identified. Panel B: original spectral matrix extracted using CARACAL, where major S/N differences are observed between the spectra (horizontal stripes), and prominent telluric H2O emission can be identified. Panel C: normalized spectra, where a 3σ clipping has been applied to filter out outliers and where telluric masks have been applied (white, excluded pixels). All spectra are now normalized to a common continuum. Panel D: resulting spectra after one SysRem pass, where major residuals can be observed, especially from emission lines. Panel E: spectra after nine SysRem passes, where most of the telluric contribution has been removed and any exoplanet signal, if present, is buried in the noise.
Current usage metrics show cumulative count of Article Views (full-text article views including HTML views, PDF and ePub downloads, according to the available data) and Abstracts Views on Vision4Press platform.
Data correspond to usage on the plateform after 2015. The current usage metrics is available 48-96 hours after online publication and is updated daily on week days.
Initial download of the metrics may take a while.