Fig. 8
Download original image
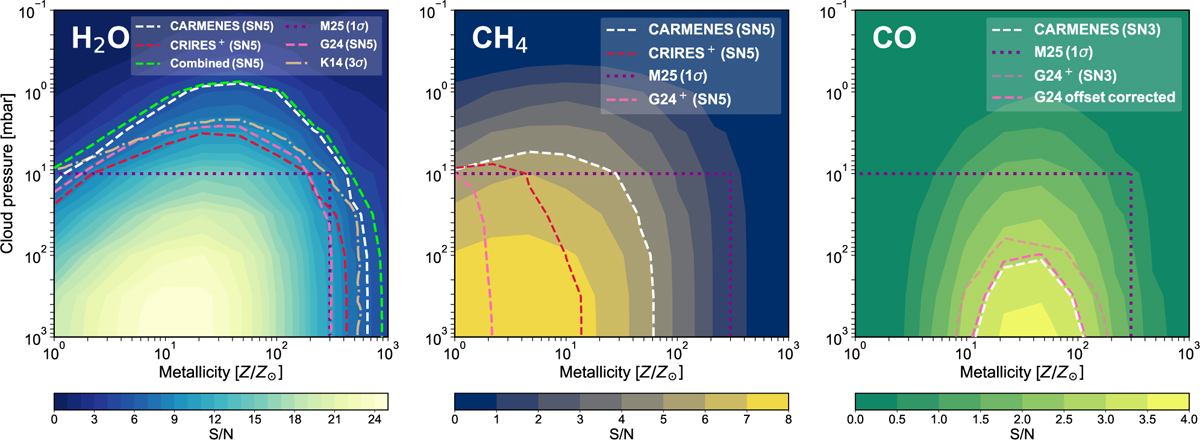
Detectability maps obtained from injection recovery tests, showing upper limits on the abundances of the main near-infrared absorbers in the atmosphere of G 436 b. Specifically, we investigated H2O (left panel), CH4 (middle panel), and CO (right panel) across a range of metallicities and cloud deck altitudes. Dashed lines indicate the S/N = 5 contours (‘SN5’, S/N = 3 for CO denoted as ‘SN3’) obtained from CARMENES (white, five transits combined), CRIRES+ (red, one transit), and combining the results from both instruments (green). The dotted pink lines mark the S/N = 5 (S/N = 3 for CO) contours from Grasser et al. (2024), referred to as ‘G24’, using the same CRIRES+ dataset. For CO, an additional contour with a potential offset corrected is also shown as ‘G24 offset corrected’ (see discussion in Sect. 5.4). The dash-dotted brown line corresponds to the 99.7% upper limit from Fig. 3 in Knutson et al. (2014a), referred to as ‘K14’. The latter values were extracted from their respective figures. The dashed purple line represents the 68% upper limit placed by Mukherjee et al. (2025), referred to as ‘M25’. The area below each curve represents the discarded atmospheric parameter values.
Current usage metrics show cumulative count of Article Views (full-text article views including HTML views, PDF and ePub downloads, according to the available data) and Abstracts Views on Vision4Press platform.
Data correspond to usage on the plateform after 2015. The current usage metrics is available 48-96 hours after online publication and is updated daily on week days.
Initial download of the metrics may take a while.