Fig. 9
Download original image
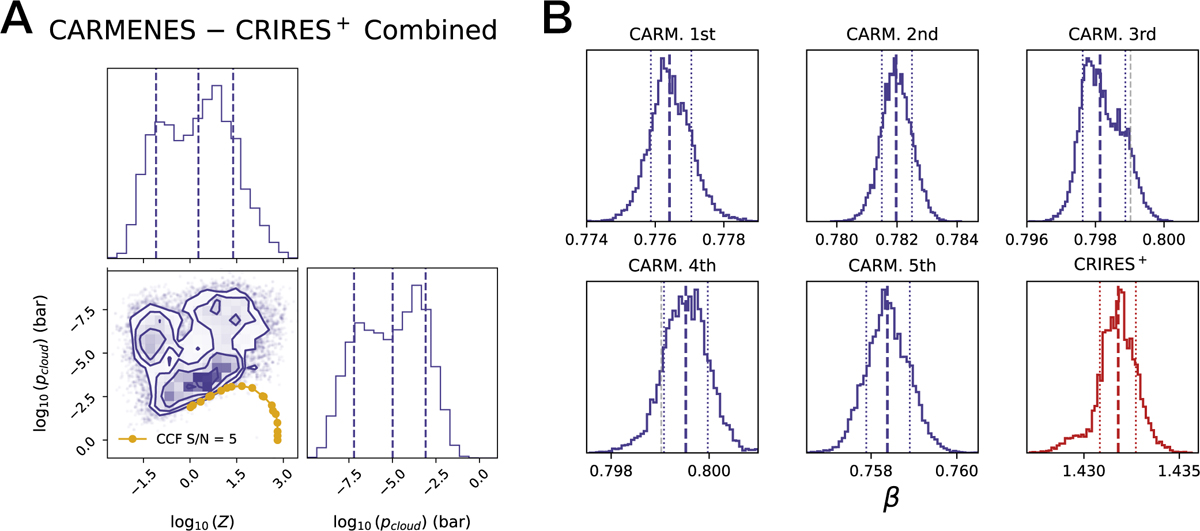
Posterior distributions from atmospheric retrievals of six transit datasets of GJ 436 b, five from CARMENES, and one from CRIRES+. Panel A: combination of all useful transit datasets from both instruments. This yields the marginalized one-dimensional posteriors shown in the diagonal panels for log10(Z/Z⊙) and log10(pc), with vertical lines at the 16th, 50th, and 84th percentiles. The off-diagonal panel shows the two-dimensional posterior density estimated from the combined samples, with contours indicating enclosed-probability regions (we display 68.3%, 95.5%, and 99.7% levels). For comparison, the CCF injection-recovery curve (S/N = 5, yellow) is overplotted in the log10(pc) vs. log10(Z/Z⊙) panel. Panel B: marginalized one-dimensional posteriors for the β parameter separately for CARMENES (five transits) and CRIRES+ (one transit).
Current usage metrics show cumulative count of Article Views (full-text article views including HTML views, PDF and ePub downloads, according to the available data) and Abstracts Views on Vision4Press platform.
Data correspond to usage on the plateform after 2015. The current usage metrics is available 48-96 hours after online publication and is updated daily on week days.
Initial download of the metrics may take a while.