Fig. 1.
Download original image
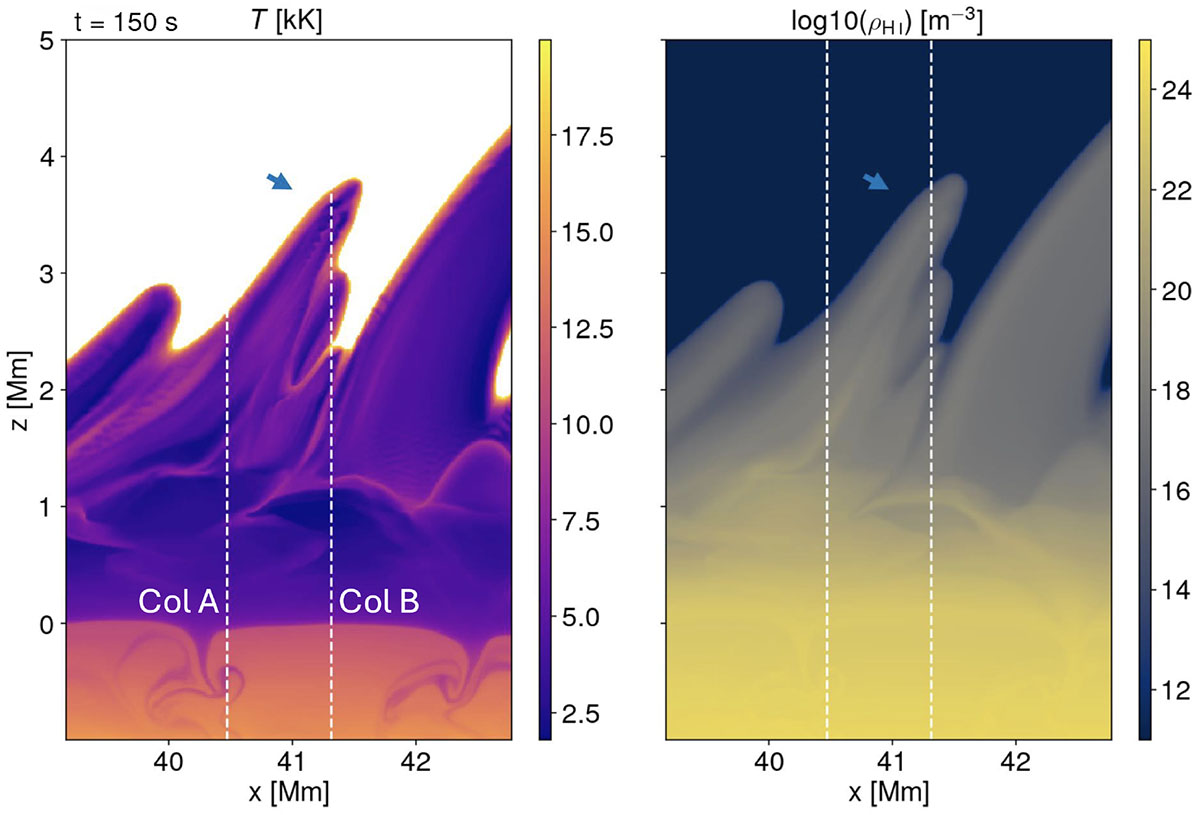
Spicule at the beginning of its ascending phase, indicated by the blue arrows. The left frame shows the temperature, saturated at 20 kK. The right frame shows the logarithm of the neutral hydrogen number density. The dashed lines represent the columns A and B used for calculating the Hαλt diagrams, presented in Fig. 2. An animation of this figure is available online.
Current usage metrics show cumulative count of Article Views (full-text article views including HTML views, PDF and ePub downloads, according to the available data) and Abstracts Views on Vision4Press platform.
Data correspond to usage on the plateform after 2015. The current usage metrics is available 48-96 hours after online publication and is updated daily on week days.
Initial download of the metrics may take a while.