Fig. 2.
Download original image
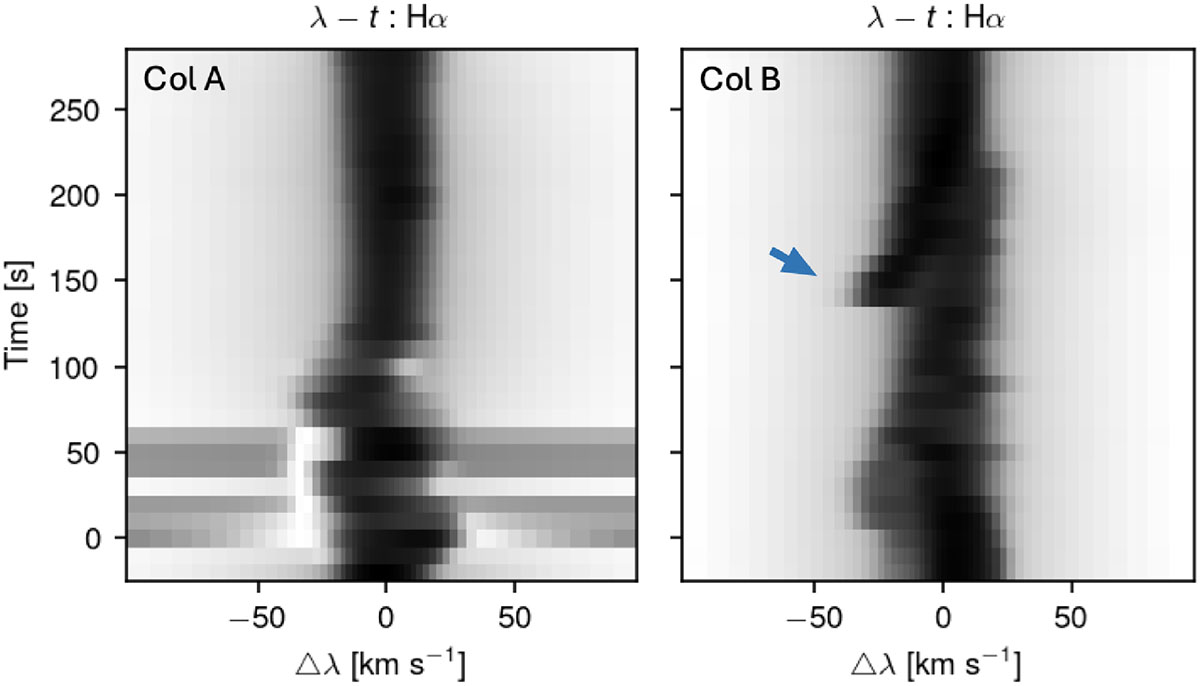
Temporal evolution of the Hα synthetic spectral profiles in λt diagrams for the EB (left panel) and the connected spicule (right panel). The EB and spicule spectra are calculated along the columns A and B marked by the dashed lines in Fig. 1. The blue arrow indicates the spectral profile corresponding to the timeframe presented in Fig. 1. The EB’s beginning is marked by time t = 0, corresponding to 290 s in the simulation of MS20.
Current usage metrics show cumulative count of Article Views (full-text article views including HTML views, PDF and ePub downloads, according to the available data) and Abstracts Views on Vision4Press platform.
Data correspond to usage on the plateform after 2015. The current usage metrics is available 48-96 hours after online publication and is updated daily on week days.
Initial download of the metrics may take a while.