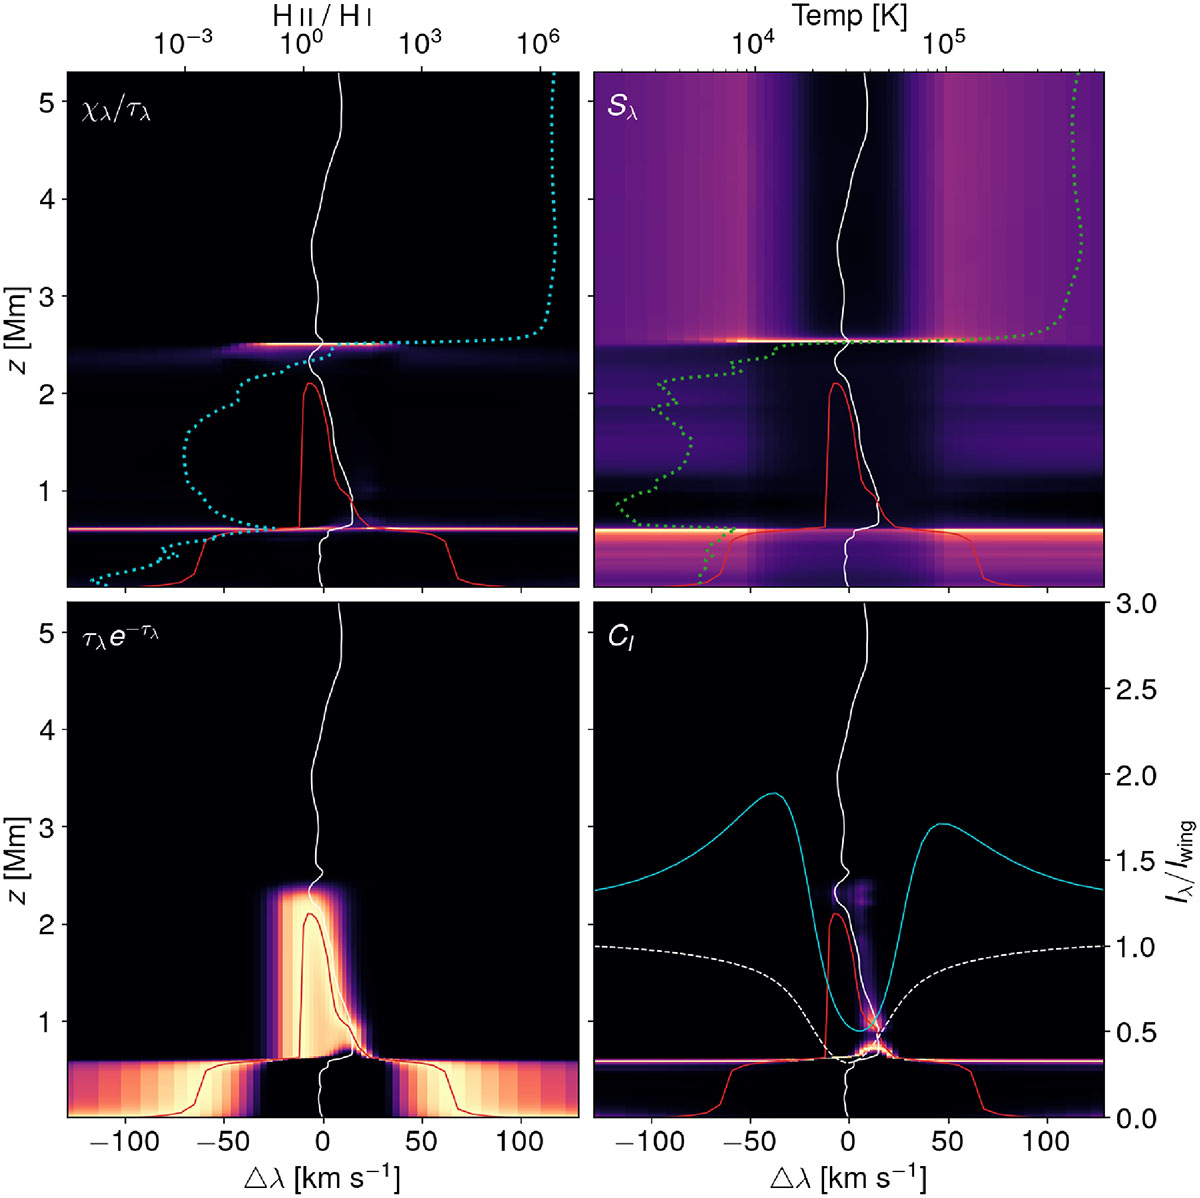
Fig. 3.
Download original image
Formation of the Hα intensity profile for the EB at t = 0 from column A marked in Fig. 1. The contribution function to emergent intensity CI in the lower right panel can be calculated as the product of the three factors shown in the other panels. The height where τλ = 1 (solid red) and the velocity profile in the z-direction (solid white) are plotted in all panels (negative velocities correspond to blueshift, i.e. upflows, while positive values are downflows). The top left panel shows the factor χλ/τλ, i.e. the ratio between the opacity and optical depth; the dotted cyan line shows the ionised to neutral hydrogen ratio as a function of height. The top right panel shows the monochromatic source function Sλ; the dotted green line shows the atmosphere’s temperature profile. The lower left panel shows the factor τλ/e−τλ, i.e. a function that peaks in the region where τλ ≈ 1. The lower right panel shows the contribution to emergent intensity CI. The solid cyan line shows the Hα spectral profile of the EB, while the dotted white line shows an Hα background profile, i.e. the average profile over many columns and scans. The spectral profile is normalised to Iwing, which is the average intensity of the outermost wavelength points in the blue and red wings of the background profile.
Current usage metrics show cumulative count of Article Views (full-text article views including HTML views, PDF and ePub downloads, according to the available data) and Abstracts Views on Vision4Press platform.
Data correspond to usage on the plateform after 2015. The current usage metrics is available 48-96 hours after online publication and is updated daily on week days.
Initial download of the metrics may take a while.