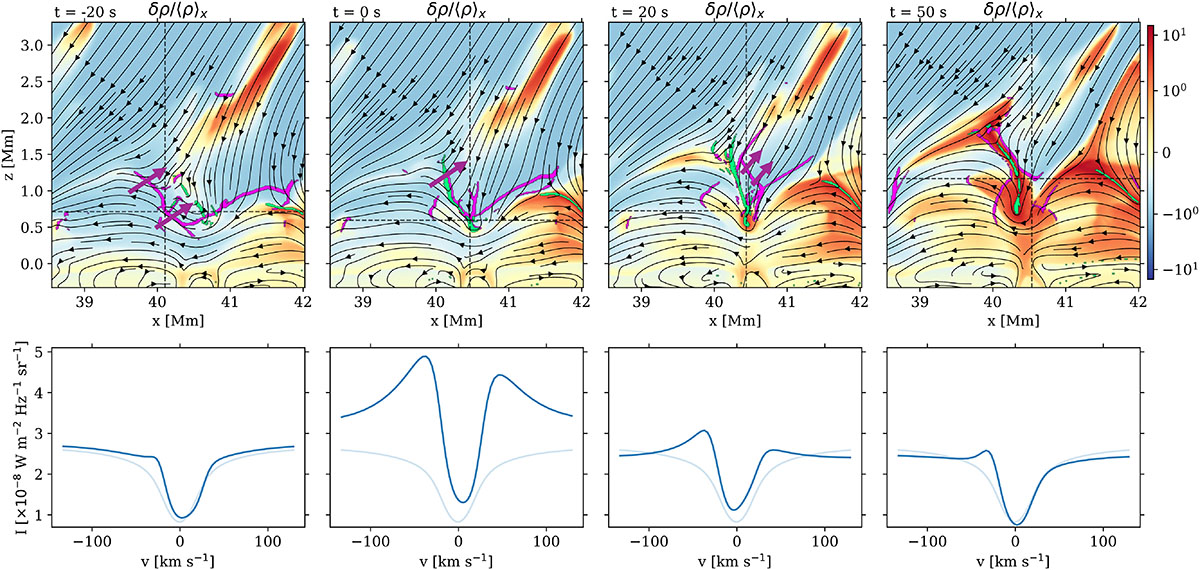
Fig. 4.
Download original image
Time series illustrating the four main physical processes that trigger the EB and form the spicule. From left to right: propagation of a magnetoacoustic shock front; the generation of a current sheet by the shock; formation of a reconnecting current sheet; plasma ejection via reconnection outflows, ultimately leading to the formation of the rising spicule. Top: Normalised density fluctuation maps, δρ/⟨ρ⟩x, with detected shocks and current sheets overlaid in magenta and green, respectively. Thick purple arrows indicate the direction of the shock’s motion. The solid lines with arrows indicate the direction of the magnetic field. The vertical, dotted line marks the column that is used for integration of the synthetic spectrum; the horizontal, dotted line marks the formation height of the EB; the intersection between the dotted lines marks the location of the EB. Bottom: EB spectra (strong colour) corresponding to the column marked by the vertical dotted line, along with an Hα background profile (weak colour), i.e. the average profile over many columns and snapshots. An animation of the upper panels is available online.
Current usage metrics show cumulative count of Article Views (full-text article views including HTML views, PDF and ePub downloads, according to the available data) and Abstracts Views on Vision4Press platform.
Data correspond to usage on the plateform after 2015. The current usage metrics is available 48-96 hours after online publication and is updated daily on week days.
Initial download of the metrics may take a while.