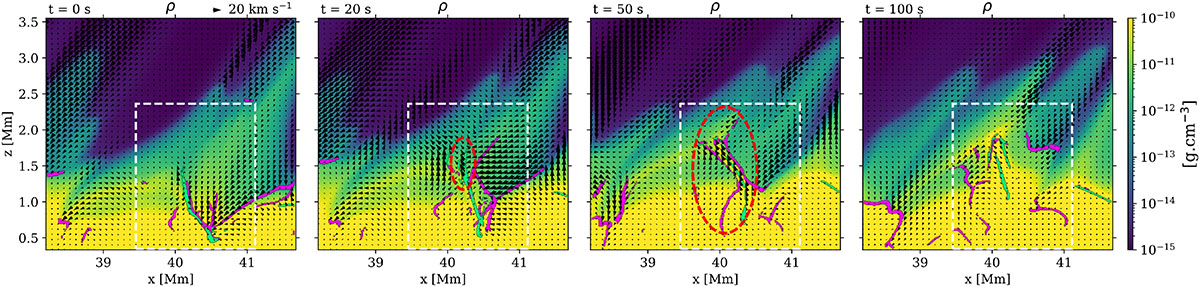
Fig. 6.
Download original image
Time series illustrating how the velocity field is impacted by the shock-current-sheet-reconnection chain of events presented in Fig. 4. The background shows the density field on a logarithmic scale, with overplotted regions where either shocks (magenta) or current sheets (green) are detected, along with the velocity field shown with dark arrows. An indicative 20 km s−1 arrow above the left panel is a reference for the scale. The white dashed rectangle outlines the field of view for the upper panels in Fig. 4. The red dashed ellipse in the third panel highlights the area where the reconnection jet forms. An animation of this figure is available online.
Current usage metrics show cumulative count of Article Views (full-text article views including HTML views, PDF and ePub downloads, according to the available data) and Abstracts Views on Vision4Press platform.
Data correspond to usage on the plateform after 2015. The current usage metrics is available 48-96 hours after online publication and is updated daily on week days.
Initial download of the metrics may take a while.