Open Access
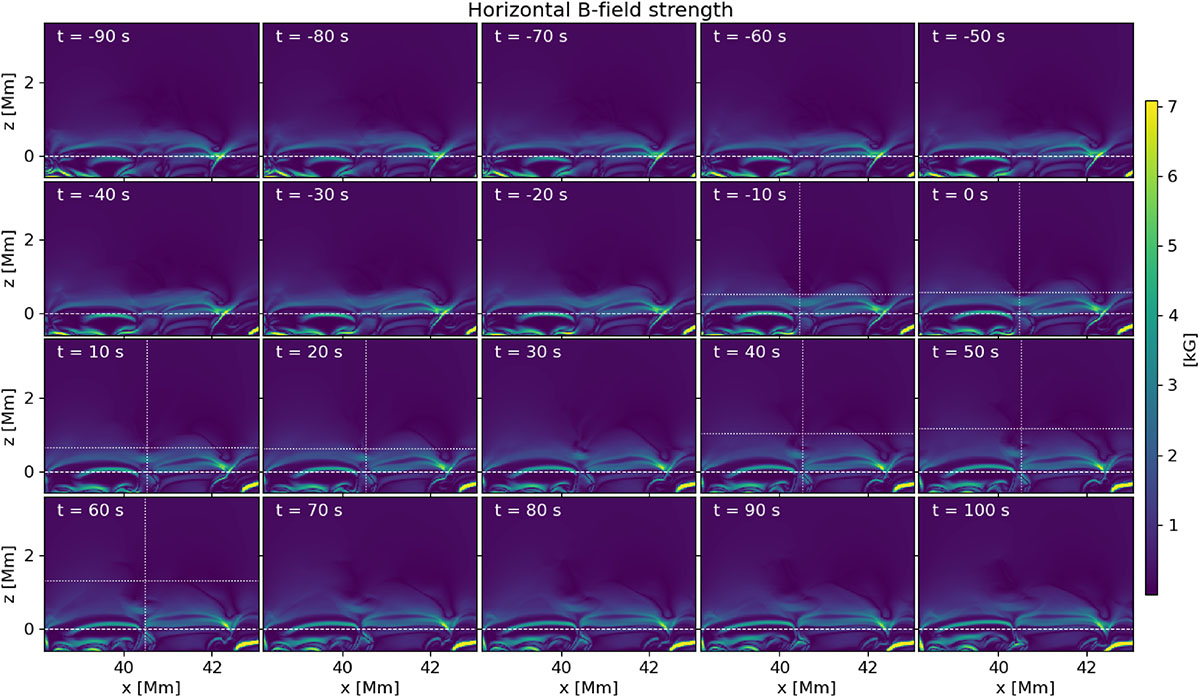
Fig. C.1.
Download original image
Temporal evolution of the horizontal magnetic field strength centred around the current sheet before, during, and after the EB. The white dashed line marks z = 0 Mm, i.e. the photosphere. The white dotted lines mark the location of the EB at their intersection. An animation of this figure is available online.
Current usage metrics show cumulative count of Article Views (full-text article views including HTML views, PDF and ePub downloads, according to the available data) and Abstracts Views on Vision4Press platform.
Data correspond to usage on the plateform after 2015. The current usage metrics is available 48-96 hours after online publication and is updated daily on week days.
Initial download of the metrics may take a while.