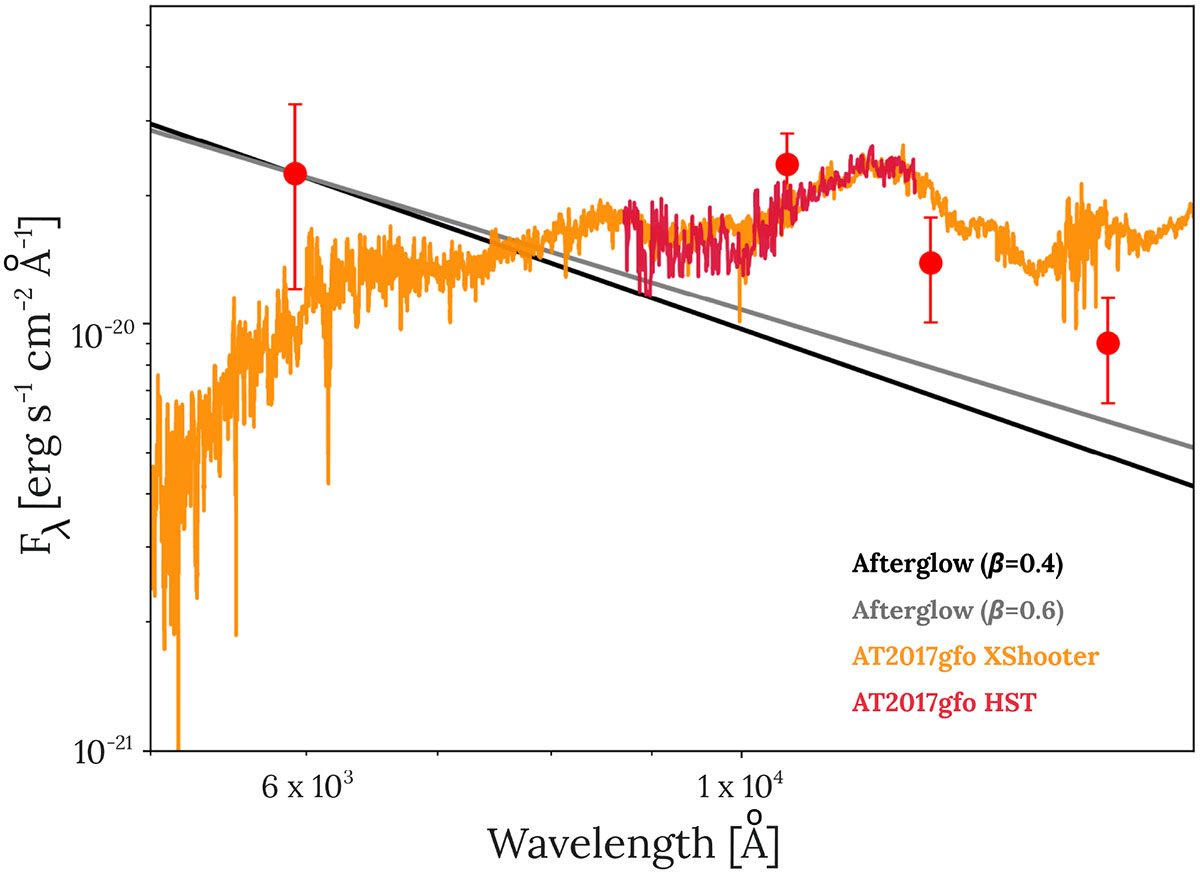
Fig. 10.
Download original image
Optical/nIR spectral energy distribution of EP250207b at 7.4 d, compared with the X-Shooter spectrum (Pian et al. 2017) and the HST spectrum (Troja et al. 2017) of AT2017gfo at a similar epoch, rescaled to match the observed photometry and redshifted to z ∼ 0.082. Data were corrected for Galactic extinction using E(B − V)≈0.05 (Schlafly & Finkbeiner 2011). The solid lines show the afterglow models.
Current usage metrics show cumulative count of Article Views (full-text article views including HTML views, PDF and ePub downloads, according to the available data) and Abstracts Views on Vision4Press platform.
Data correspond to usage on the plateform after 2015. The current usage metrics is available 48-96 hours after online publication and is updated daily on week days.
Initial download of the metrics may take a while.