Fig. 13.
Download original image
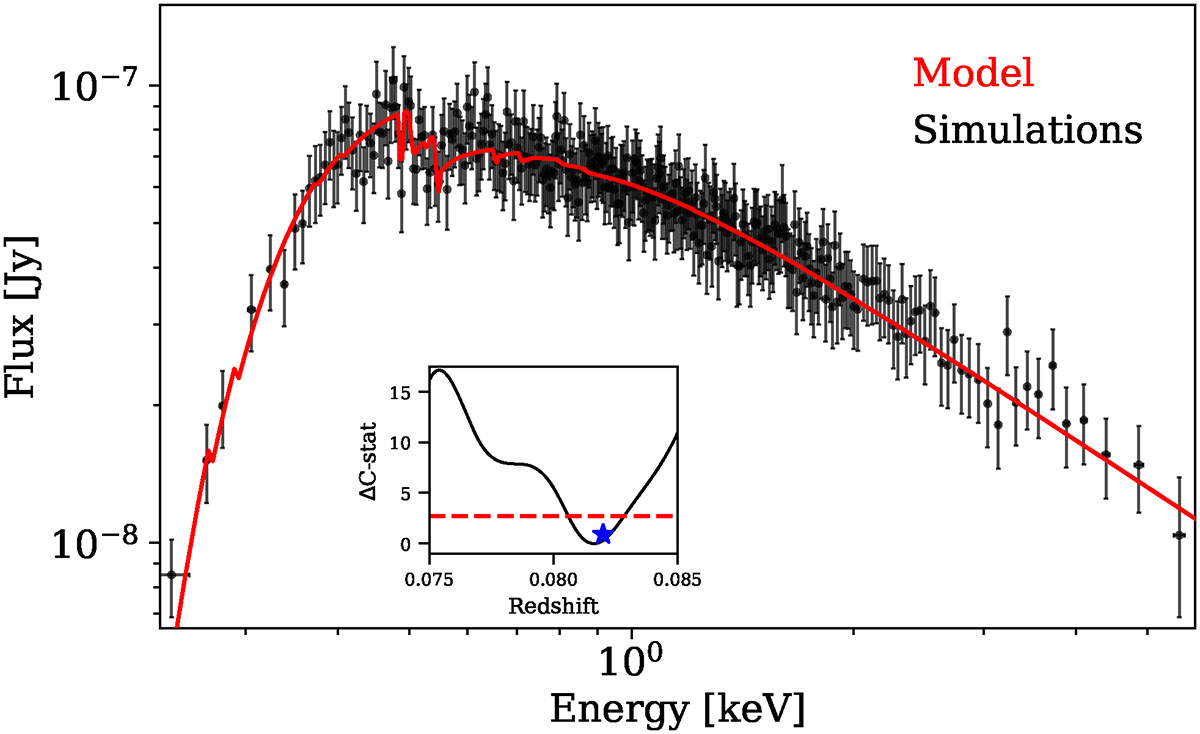
Simulated NewAthena X-IFU afterglow spectrum for an integrated flux of 5 × 10⁻¹³ erg cm−2 s−1 (0.3–10 keV). The best-fit absorbed power-law model is overplotted in red. The inset shows the redshift contours, and the dashed line ΔC-stat = 2.706 defines the 90% confidence level for a single free parameter (Lampton et al. 1976). The star indicates the true z used in the simulation.
Current usage metrics show cumulative count of Article Views (full-text article views including HTML views, PDF and ePub downloads, according to the available data) and Abstracts Views on Vision4Press platform.
Data correspond to usage on the plateform after 2015. The current usage metrics is available 48-96 hours after online publication and is updated daily on week days.
Initial download of the metrics may take a while.