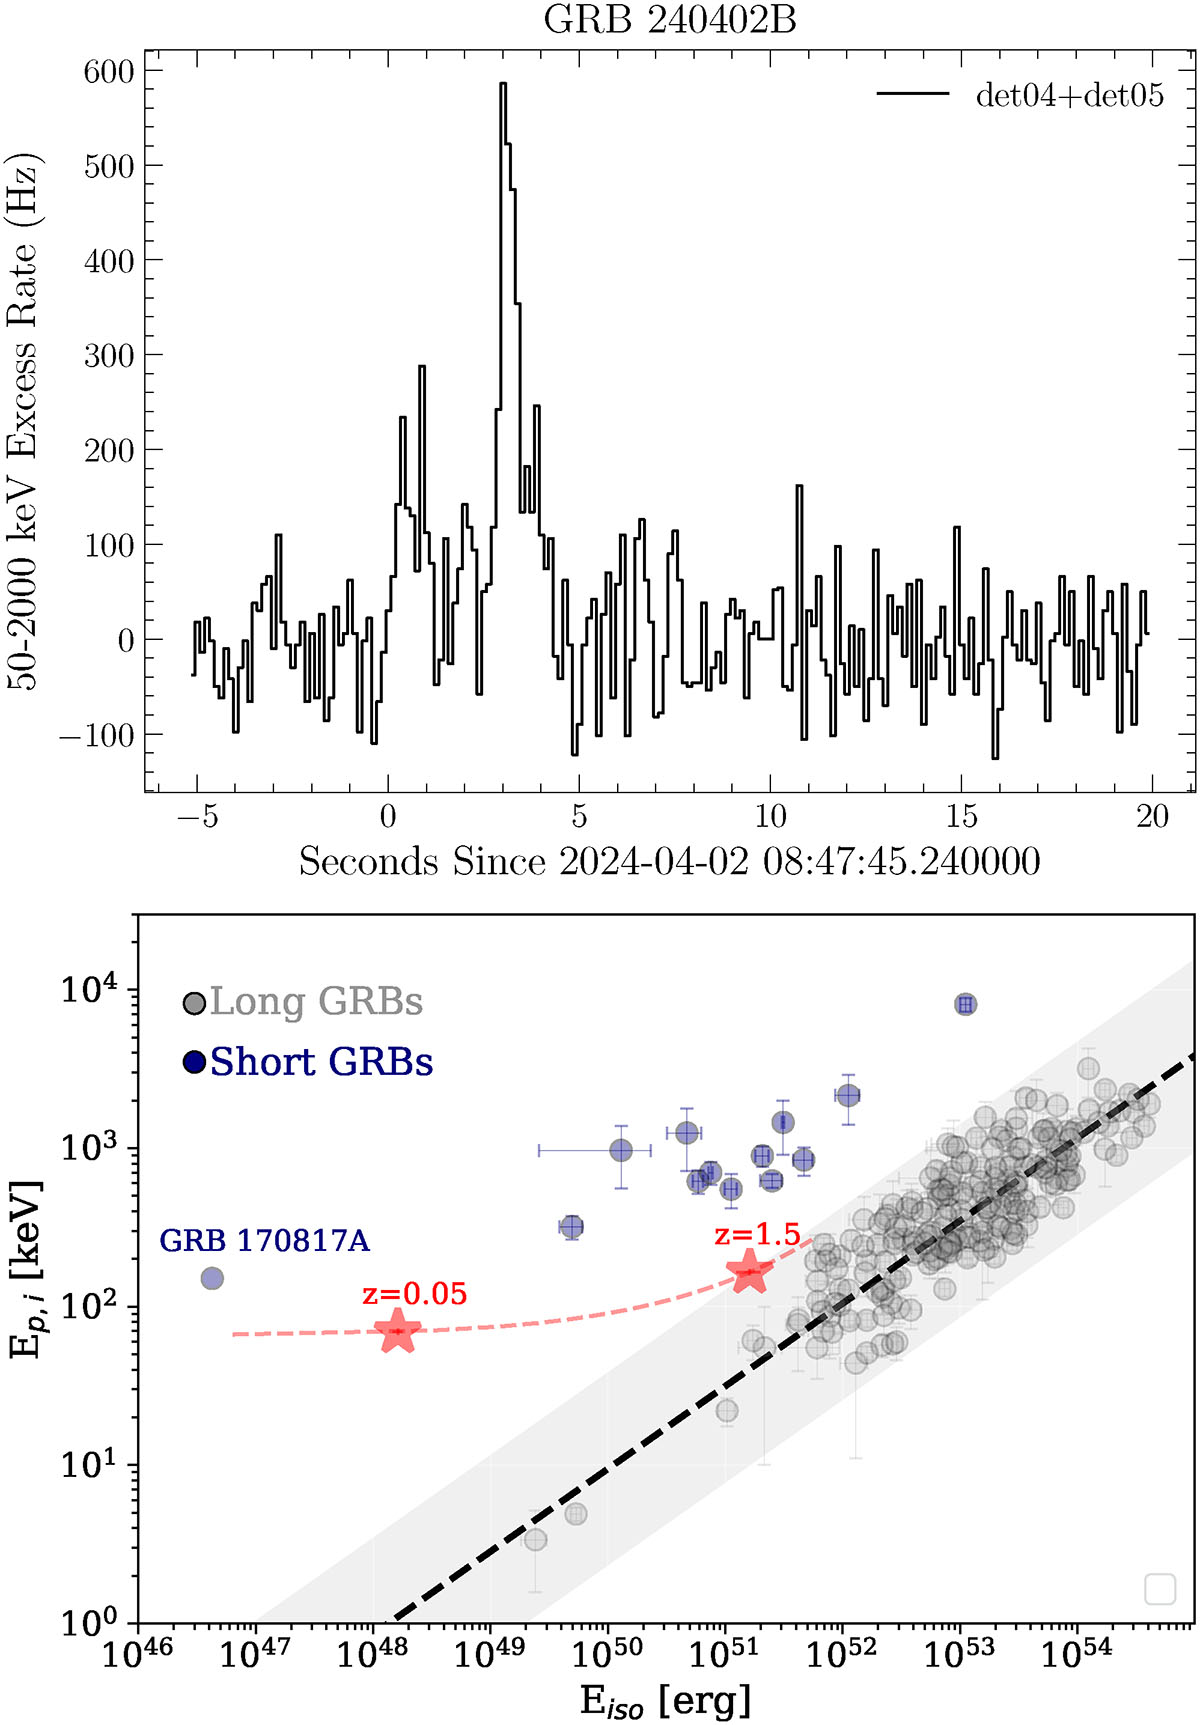
Fig. 2.
Download original image
Light curve and Epeak – Eiso function. Top panel: Background-subtracted 50 keV–2 MeV light curve of GRB 240402B in 0.125-s bins as observed by Glowbug. The two primary peaks at T0+0.5 s and T0+3 s as described in Cheung et al. (2024) are visible, with additional sub-structure in the light curve that is overall consistent with that observed by Konus-Wind (Ridnaia et al. 2024b). Bottom panel: Epeak – Eiso diagram for long (grey) and short GRBs (blue), updated from Dichiara et al. (2021). The position of LXT 240402A/GRB 240402B is shown as a function of redshift, highlighting z = 0.048 and 1.5. The Amati relation (dashed line; Amati et al. 2008) and its 2σ scatter (grey area) are shown.
Current usage metrics show cumulative count of Article Views (full-text article views including HTML views, PDF and ePub downloads, according to the available data) and Abstracts Views on Vision4Press platform.
Data correspond to usage on the plateform after 2015. The current usage metrics is available 48-96 hours after online publication and is updated daily on week days.
Initial download of the metrics may take a while.