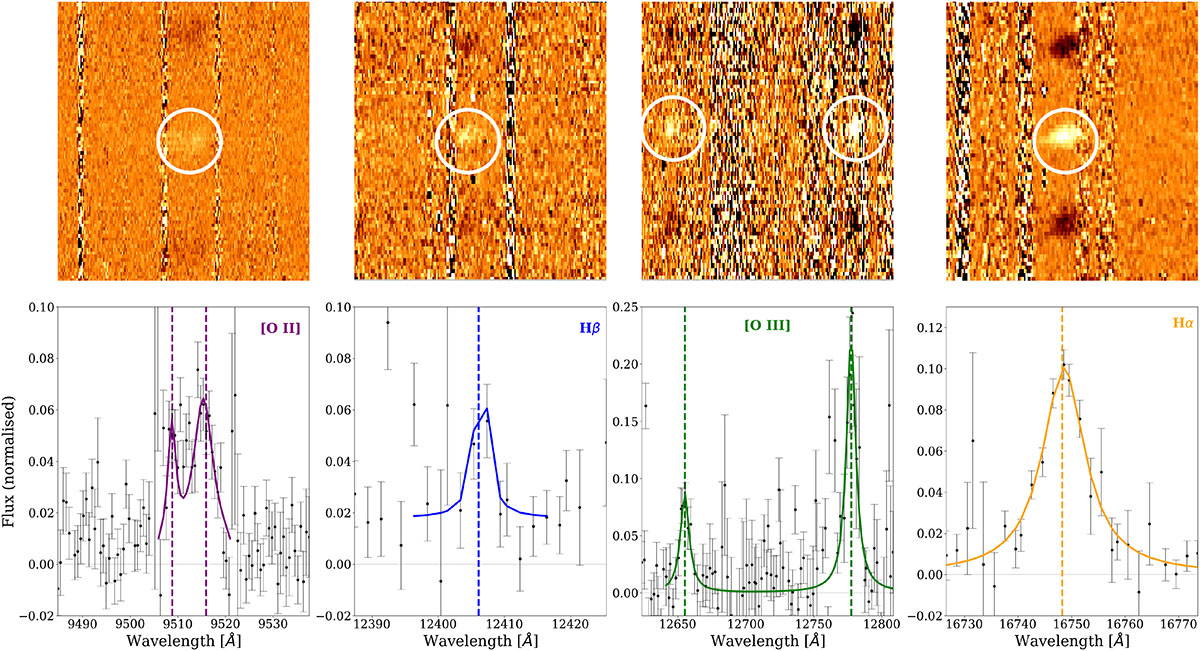
Fig. 4.
Download original image
VLT/X-Shooter spectrum of the faint galaxy underlying the position of LXT240402A. The bottom panels show the one-dimensional spectrum (black points), smoothed with a three-pixel binning, along with its standard deviation (black error bars), zoomed in around the identified emission lines. The flux is normalised to its maximum value. The dashed lines mark the positions of the features, while the solid lines show their Lorentzian fits; from left to right: [O II] (purple), Hβ (blue), [O III] (green), and Hα (yellow). The top panels display the corresponding emission features in the two-dimensional spectrum (x-axis: wavelength; y-axis: spatial direction), highlighted by white circles.
Current usage metrics show cumulative count of Article Views (full-text article views including HTML views, PDF and ePub downloads, according to the available data) and Abstracts Views on Vision4Press platform.
Data correspond to usage on the plateform after 2015. The current usage metrics is available 48-96 hours after online publication and is updated daily on week days.
Initial download of the metrics may take a while.