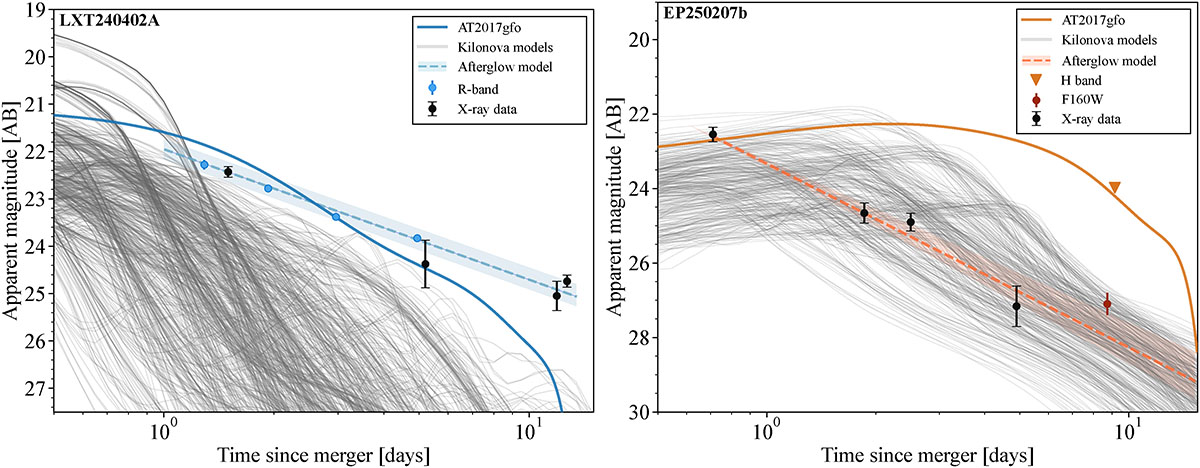
Fig. 9.
Download original image
Light curve comparison between models and observations of LXT240402B at z ∼ 0.048 (optical; left) and EP250207b at z ∼ 0.082 (near-infrared; right). The thick solid line shows the light curve of AT2017gfo at the same redshift. Detections (upper limits) are shown by circles (downward triangles). The dashed line traces the afterglow model, extrapolated from X-ray energies, with its 1σ uncertainty band. X-ray data were rescaled for plotting purposes. In gray we report the ensemble of kilonova models consistent with the observational constraints.
Current usage metrics show cumulative count of Article Views (full-text article views including HTML views, PDF and ePub downloads, according to the available data) and Abstracts Views on Vision4Press platform.
Data correspond to usage on the plateform after 2015. The current usage metrics is available 48-96 hours after online publication and is updated daily on week days.
Initial download of the metrics may take a while.