Fig. 10.
Download original image
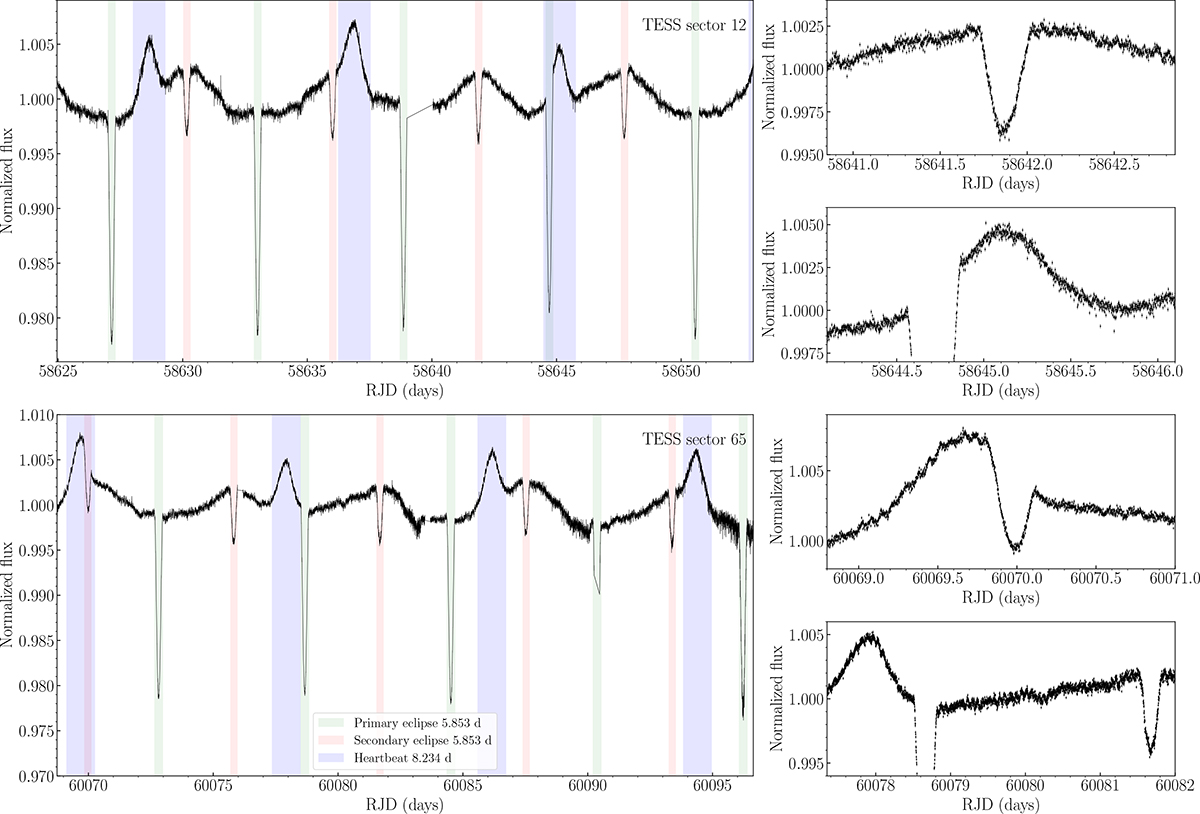
Left: TESS light curve of HD 135160 from sector 12 (top) and 65 (bottom) with the 120 s exposure times using SAP flux. Primary (green) and secondary eclipses (red) of binary B with a 5![]() 853 period and heartbeat effect of binary A (blue) with a 8
853 period and heartbeat effect of binary A (blue) with a 8![]() 234 period are shown. Primary eclipse at RJD 58644.71 and secondary eclipse at RJD 60069.69 of binary B is reduced by heartbeat of binary A. Right: Zoomed plots of visible oscillations with a period of 0
234 period are shown. Primary eclipse at RJD 58644.71 and secondary eclipse at RJD 60069.69 of binary B is reduced by heartbeat of binary A. Right: Zoomed plots of visible oscillations with a period of 0![]() 071. This small variability is not always clearly visible due to changing signal noise. LCs are normalized per sector to their median values.
071. This small variability is not always clearly visible due to changing signal noise. LCs are normalized per sector to their median values.
Current usage metrics show cumulative count of Article Views (full-text article views including HTML views, PDF and ePub downloads, according to the available data) and Abstracts Views on Vision4Press platform.
Data correspond to usage on the plateform after 2015. The current usage metrics is available 48-96 hours after online publication and is updated daily on week days.
Initial download of the metrics may take a while.