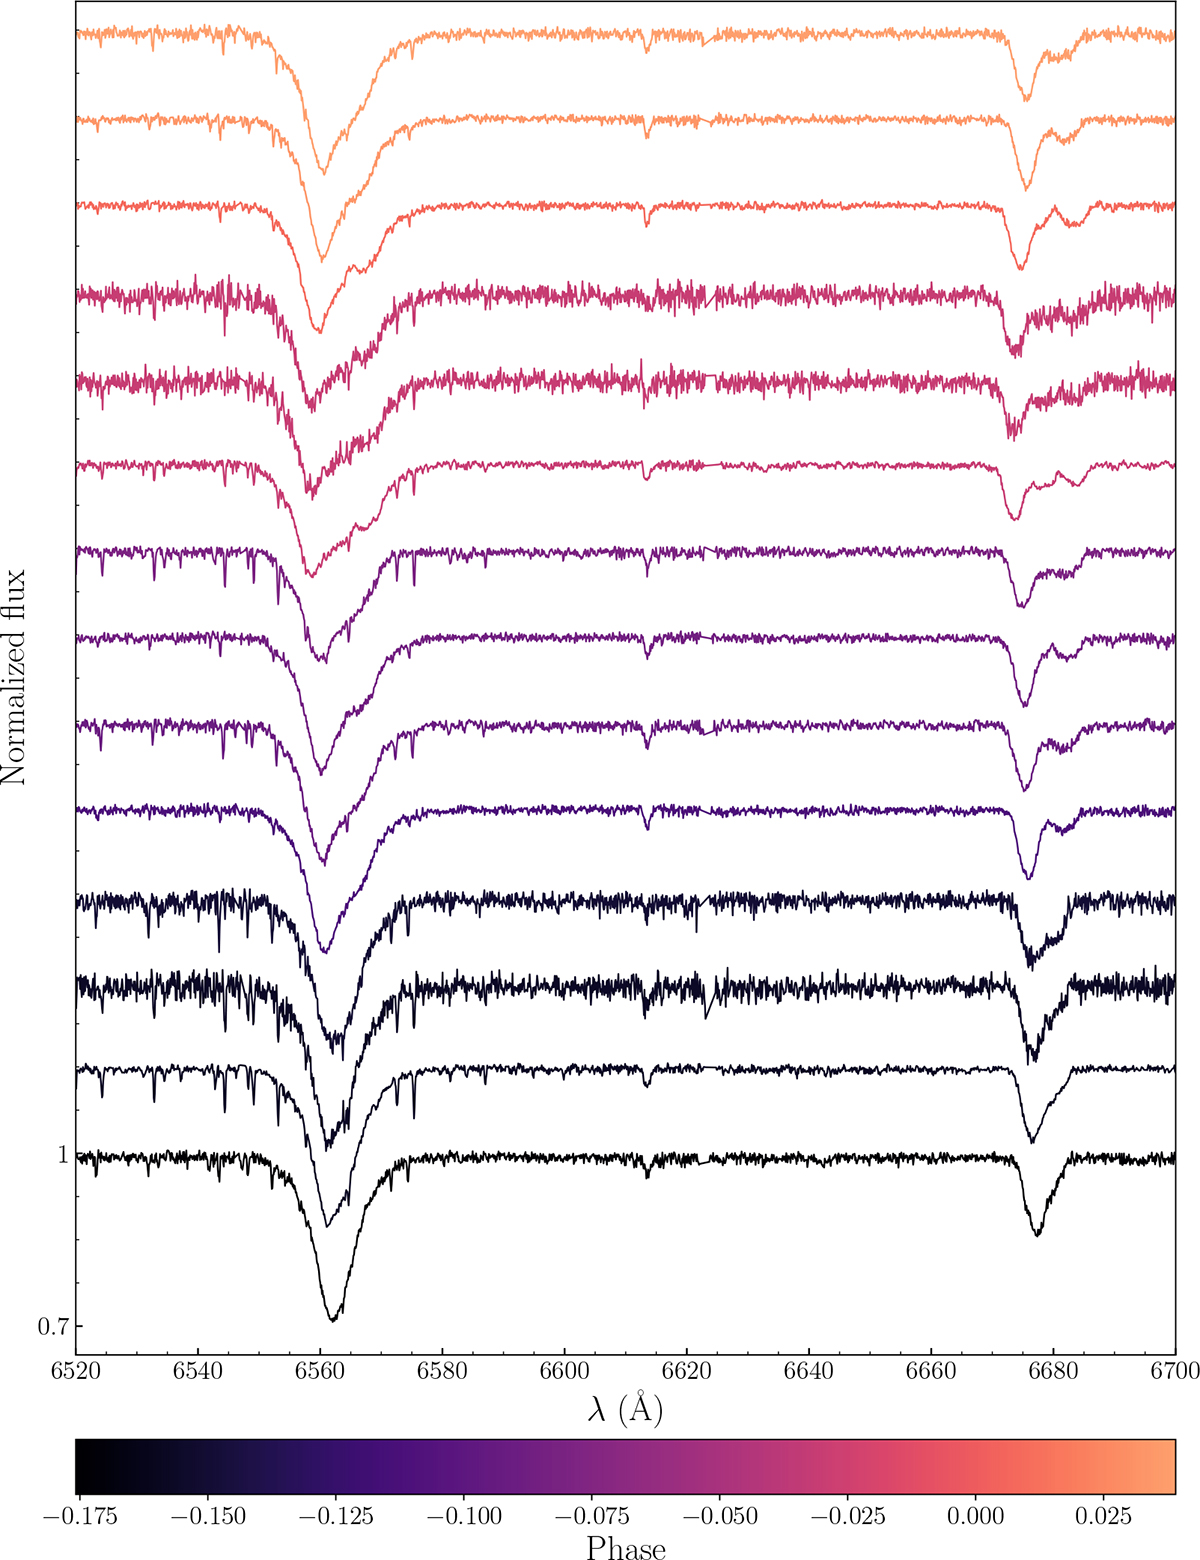
Fig. 3.
Download original image
Parts of the CHIRON spectra with Hα and He I 6678 Å ordered according to their phase for ephemeris T0, perpass = RJD59995.6424 + 8.23459 × E. Only some of the spectra are plotted, corresponding to around a third of the orbital period, so that change of the position of lines of 3 components (Aa, Ab, and Ba) is visible. Distances between spectra do not correspond to the distance in phase. Difference in S/N can be seen between 30 s, 300 s, and 500 s exposures.
Current usage metrics show cumulative count of Article Views (full-text article views including HTML views, PDF and ePub downloads, according to the available data) and Abstracts Views on Vision4Press platform.
Data correspond to usage on the plateform after 2015. The current usage metrics is available 48-96 hours after online publication and is updated daily on week days.
Initial download of the metrics may take a while.