Fig. 4
Download original image
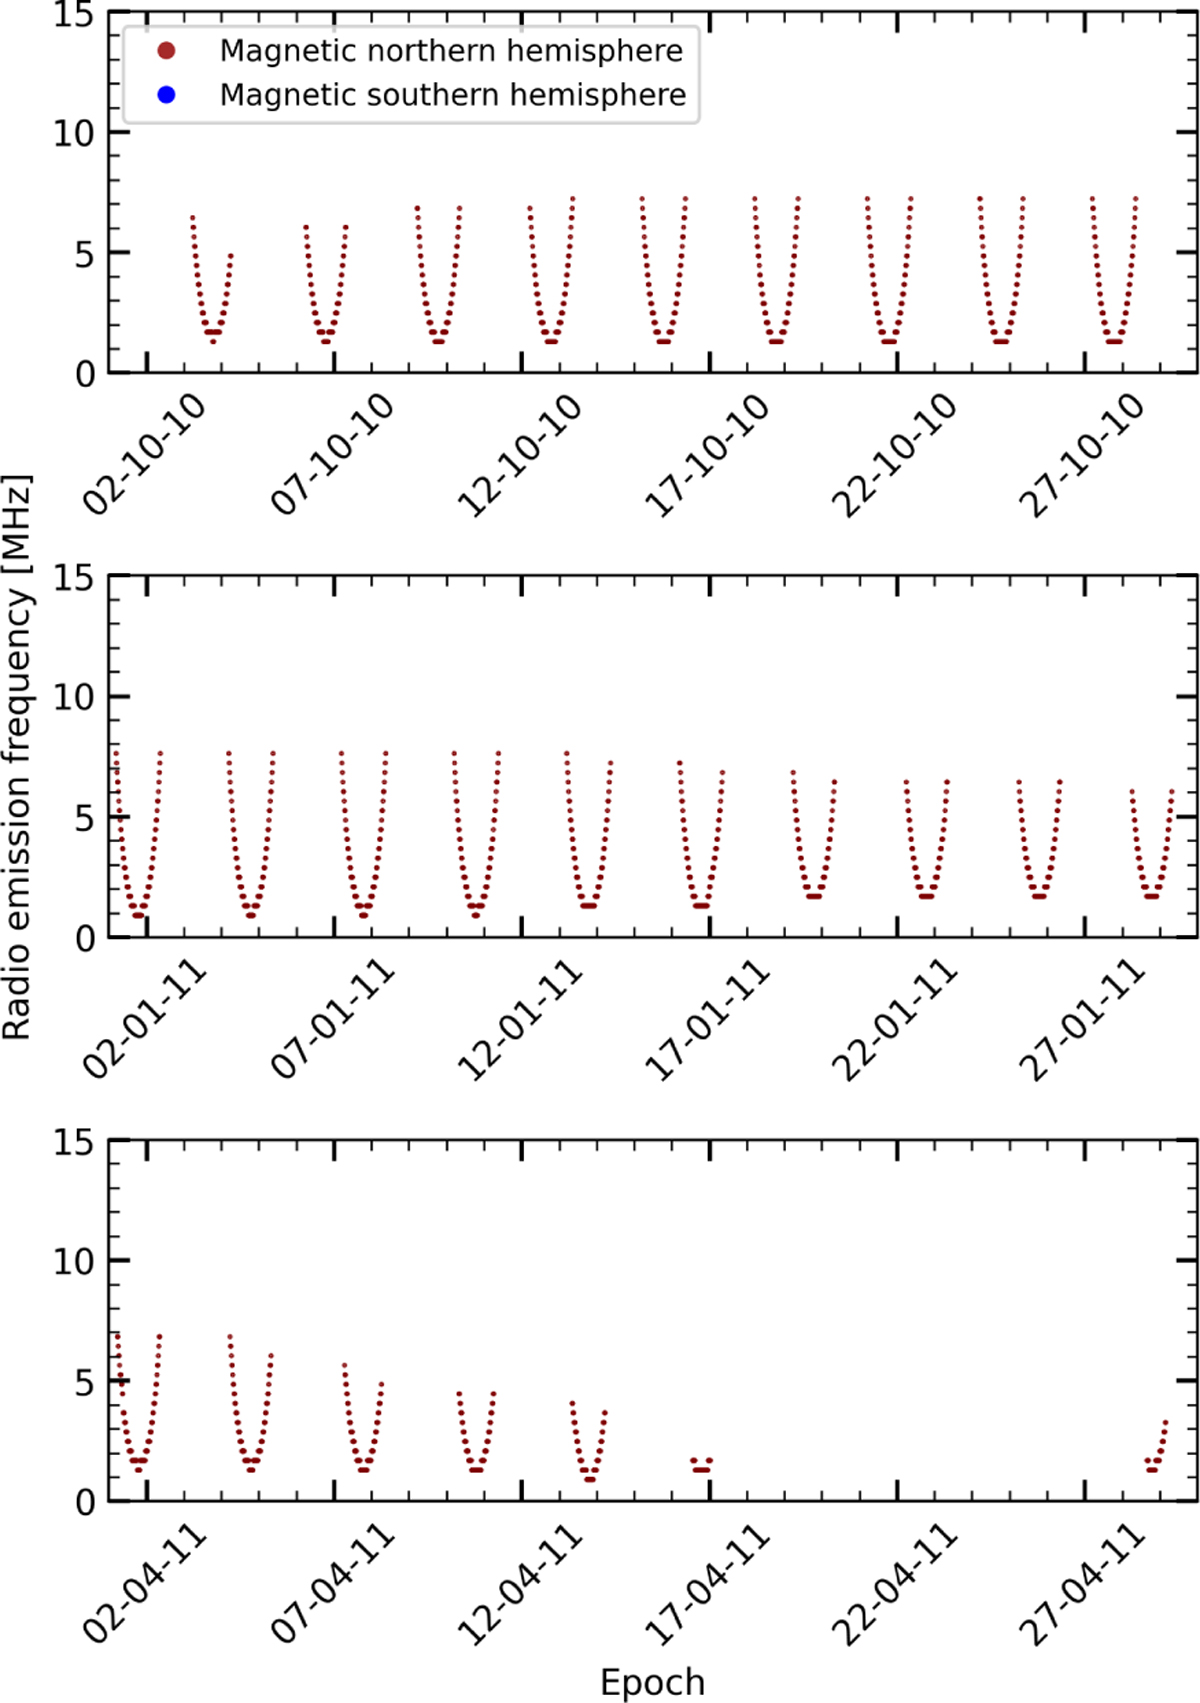
Time-frequency spectrograms showing the simulated radio emission from star–planet magnetic interactions in the Tau Boo system for selected months; October 2010 (top), January 2011 (middle), and April 2011 (bottom). The y-axis denotes the radio frequency, while the x-axis represents time, with each tick corresponding to a single day within a given month (formatted as “day:month:year”). Frequencies are color–coded by the degree of circular polarization: blue indicates emission from the magnetic southern hemisphere, corresponding to field lines directed from the star to the planet, while red indicates emission from the magnetic northern hemisphere. In both cases, the color refers to the polarity of the field at the stellar surface (or carried by the wind).
Current usage metrics show cumulative count of Article Views (full-text article views including HTML views, PDF and ePub downloads, according to the available data) and Abstracts Views on Vision4Press platform.
Data correspond to usage on the plateform after 2015. The current usage metrics is available 48-96 hours after online publication and is updated daily on week days.
Initial download of the metrics may take a while.