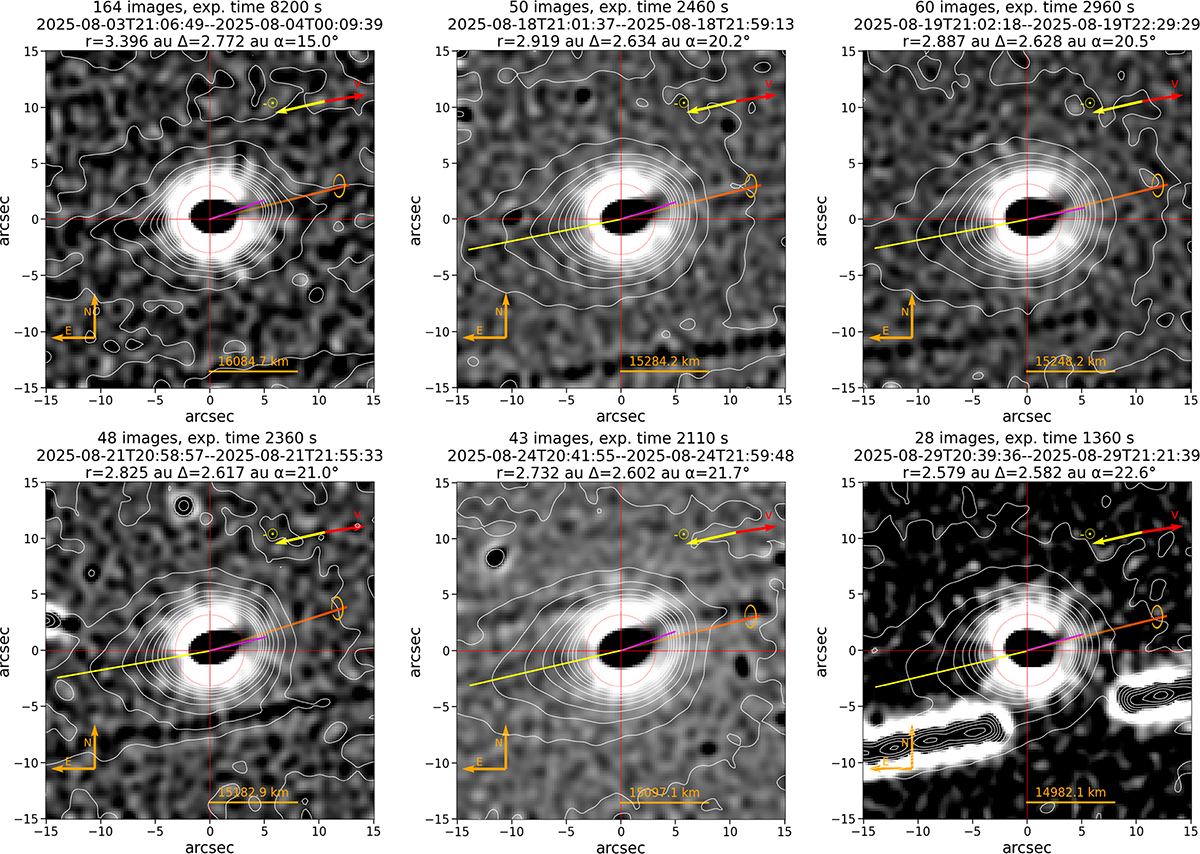
Fig. 1.
Download original image
Laplacian-filtered images of the inner coma of the interstellar comet 3I/ATLAS (C/2025 N1). Thin purple lines indicate the PA of the detected jet (median value when multiple measurements are available), calculated at a projected distance of 6000 km from the comet’s optocenter (dotted red circle). For each frame, the observation date (YYYY–MM–DD) and the start and end times in UTC are shown above the panels, together with the total number of sidereal-tracking exposures and the cumulative integration time. The projected velocity vector (red arrow) and the antisolar direction (yellow arrow) are marked, as well as the image scale and orientation. Degraded orange lines denote the projected spin-axis direction (PA = 280.7 ± 0.2°), derived from mean value of the measured jet PAs, while yellow lines trace the tail direction. Red crosshairs mark the comet’s optocenter. Isophotal contours of the original (unfiltered) images are overplotted using ten logarithmically spaced levels between the 20th and 95th percentiles of pixel intensity in each frame. The jet refers to the narrow, linear, black feature extending roughly northwest in the filtered images. It originates on the sunward side of the nucleus, in contrast to the dust tail, which points in the antisolar direction.
Current usage metrics show cumulative count of Article Views (full-text article views including HTML views, PDF and ePub downloads, according to the available data) and Abstracts Views on Vision4Press platform.
Data correspond to usage on the plateform after 2015. The current usage metrics is available 48-96 hours after online publication and is updated daily on week days.
Initial download of the metrics may take a while.