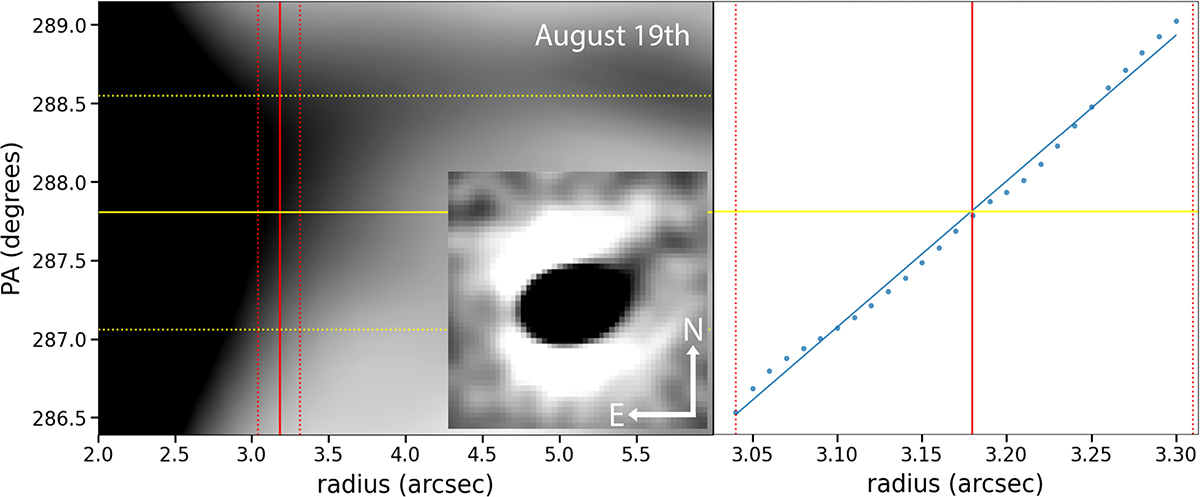
Fig. A.2.
Download original image
Left: Polar Laplacian-filtered image of 3I from the August 19 observations (the inset shows the corresponding sky-plane filtered image). From the polar-filtered frames, PA profiles were extracted at several radial distances within ±250 km (dotted red lines) around 6000 km from the optocenter (solid red line). At each radius, the PA of the jet was measured by fitting a parabola to the local intensity minimum in the jet region. Right: Linear regression of the measured PAs as a function of radius yields the final PA jet value (yellow line) with errors (dotted yellow lines) at r = 6000 km.
Current usage metrics show cumulative count of Article Views (full-text article views including HTML views, PDF and ePub downloads, according to the available data) and Abstracts Views on Vision4Press platform.
Data correspond to usage on the plateform after 2015. The current usage metrics is available 48-96 hours after online publication and is updated daily on week days.
Initial download of the metrics may take a while.