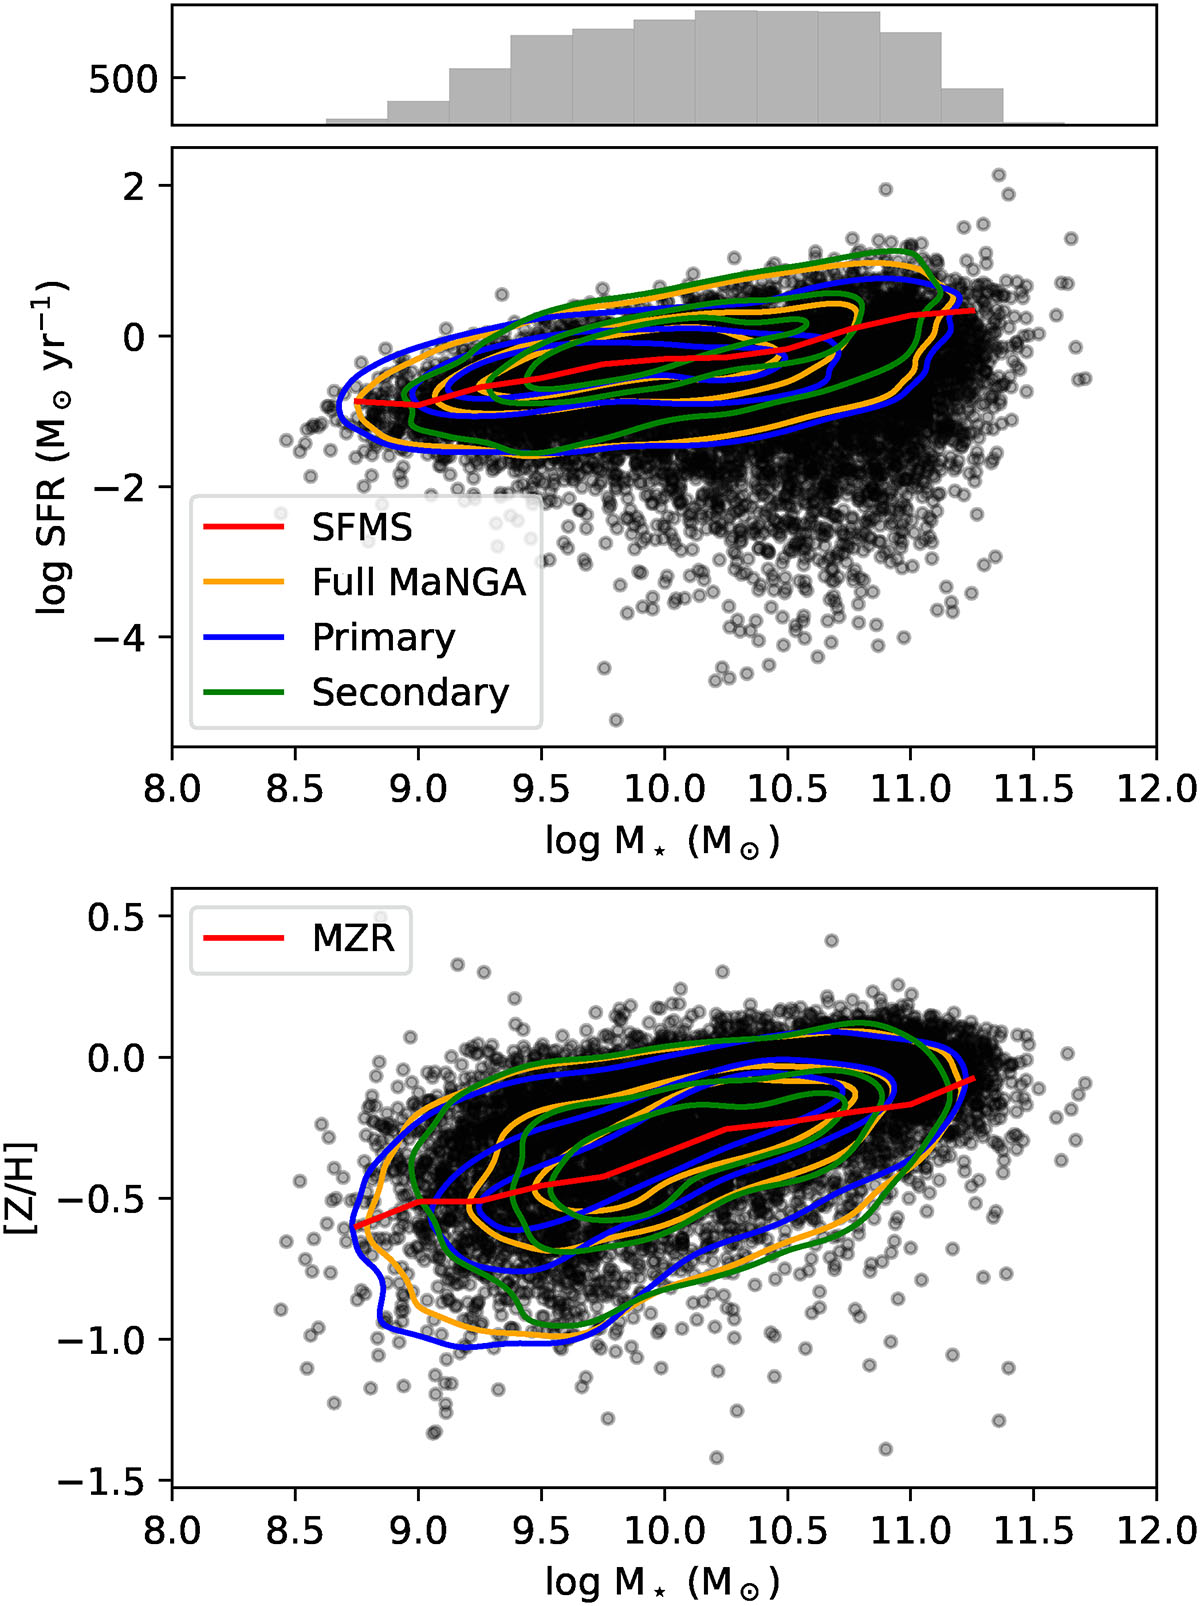
Fig. A.1.
Download original image
Comparison between the Primary and Secondary samples in MaNGA regarding their distribution in the SFMS (top) and MZR (bottom) relations. In both panels the black points correspond to all galaxies in the sample, while the red lines (averaged SFMS and MZR) and contours (35%, 65%, and 95%) represent the EWHα-selected star-forming galaxies used to measure the relations. Orange contours indicate no further selection based on the MaNGA target selection, while the blue and green contours represent, respectively, the Primary and Secondary samples.
Current usage metrics show cumulative count of Article Views (full-text article views including HTML views, PDF and ePub downloads, according to the available data) and Abstracts Views on Vision4Press platform.
Data correspond to usage on the plateform after 2015. The current usage metrics is available 48-96 hours after online publication and is updated daily on week days.
Initial download of the metrics may take a while.