Open Access
Fig. 2.
Download original image
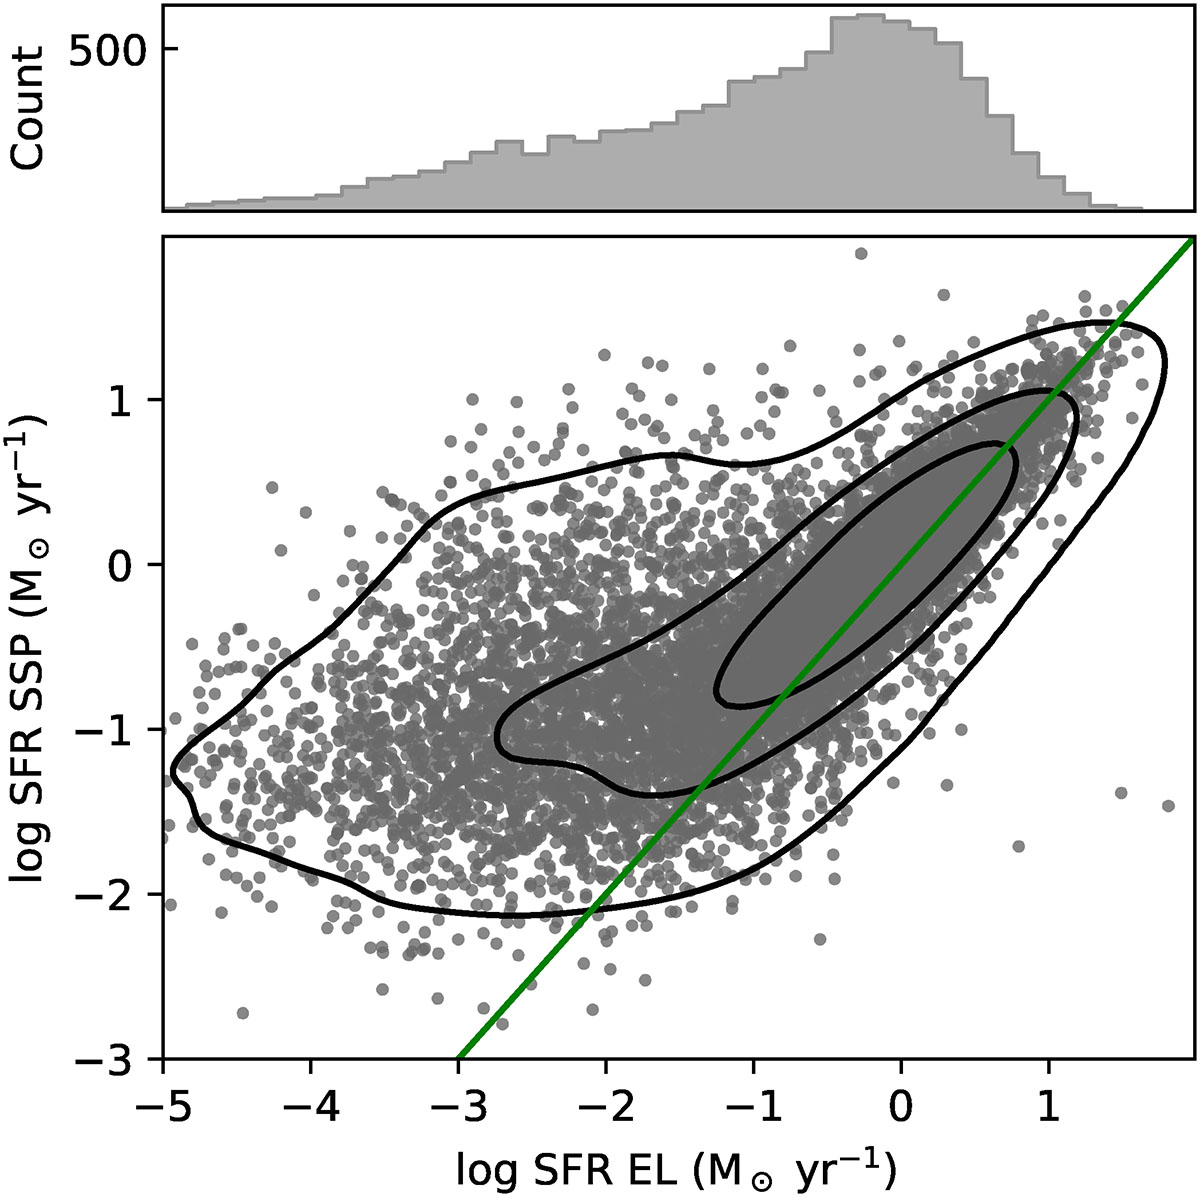
Bottom: Comparison between the SFR measured using emission lines (x-axis) and the full spectral fitting we employed, selecting the last 30 Myr (y-axis) for all 8960 galaxies in our sample. The contours are set to encompass 95%, 65%, and 35% of the sample. Top: Distribution of data points.
Current usage metrics show cumulative count of Article Views (full-text article views including HTML views, PDF and ePub downloads, according to the available data) and Abstracts Views on Vision4Press platform.
Data correspond to usage on the plateform after 2015. The current usage metrics is available 48-96 hours after online publication and is updated daily on week days.
Initial download of the metrics may take a while.