Fig. 3.
Download original image
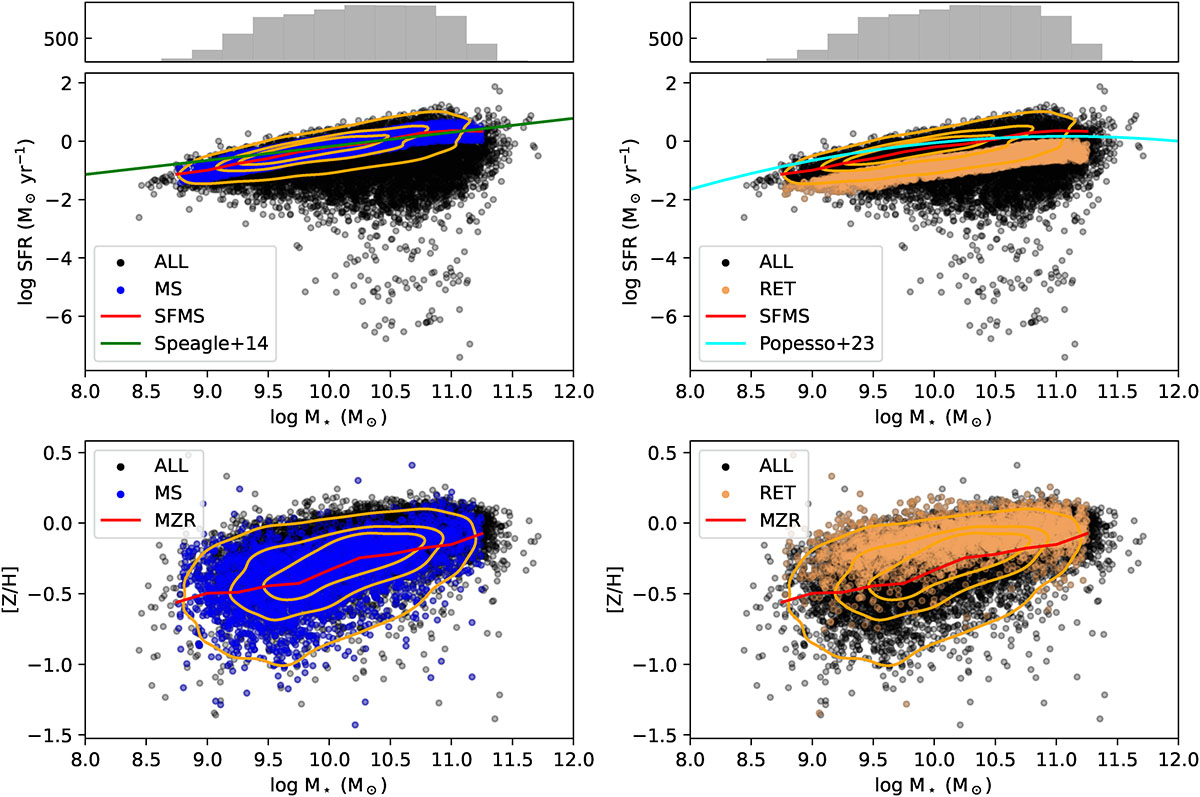
SFMS and MZR measured from the most recent values of the SFHs and the [Z/H] we employed (∼20 Myr) obtained from full spectral fitting. The full distribution (ALL) is shown as black points, with MS (blue) and RET (brown) shown in colored points in the left and right columns, respectively. The contours follow the star-forming subsample as defined in Sect. 3.2, which is used to measure the SFMS and MZR (red lines). In the top two panels we show the SFMS at z ∼ 0 from Speagle et al. (2014, left) and Popesso et al. (2023, right) for comparison with ours.
Current usage metrics show cumulative count of Article Views (full-text article views including HTML views, PDF and ePub downloads, according to the available data) and Abstracts Views on Vision4Press platform.
Data correspond to usage on the plateform after 2015. The current usage metrics is available 48-96 hours after online publication and is updated daily on week days.
Initial download of the metrics may take a while.