Fig. 6.
Download original image
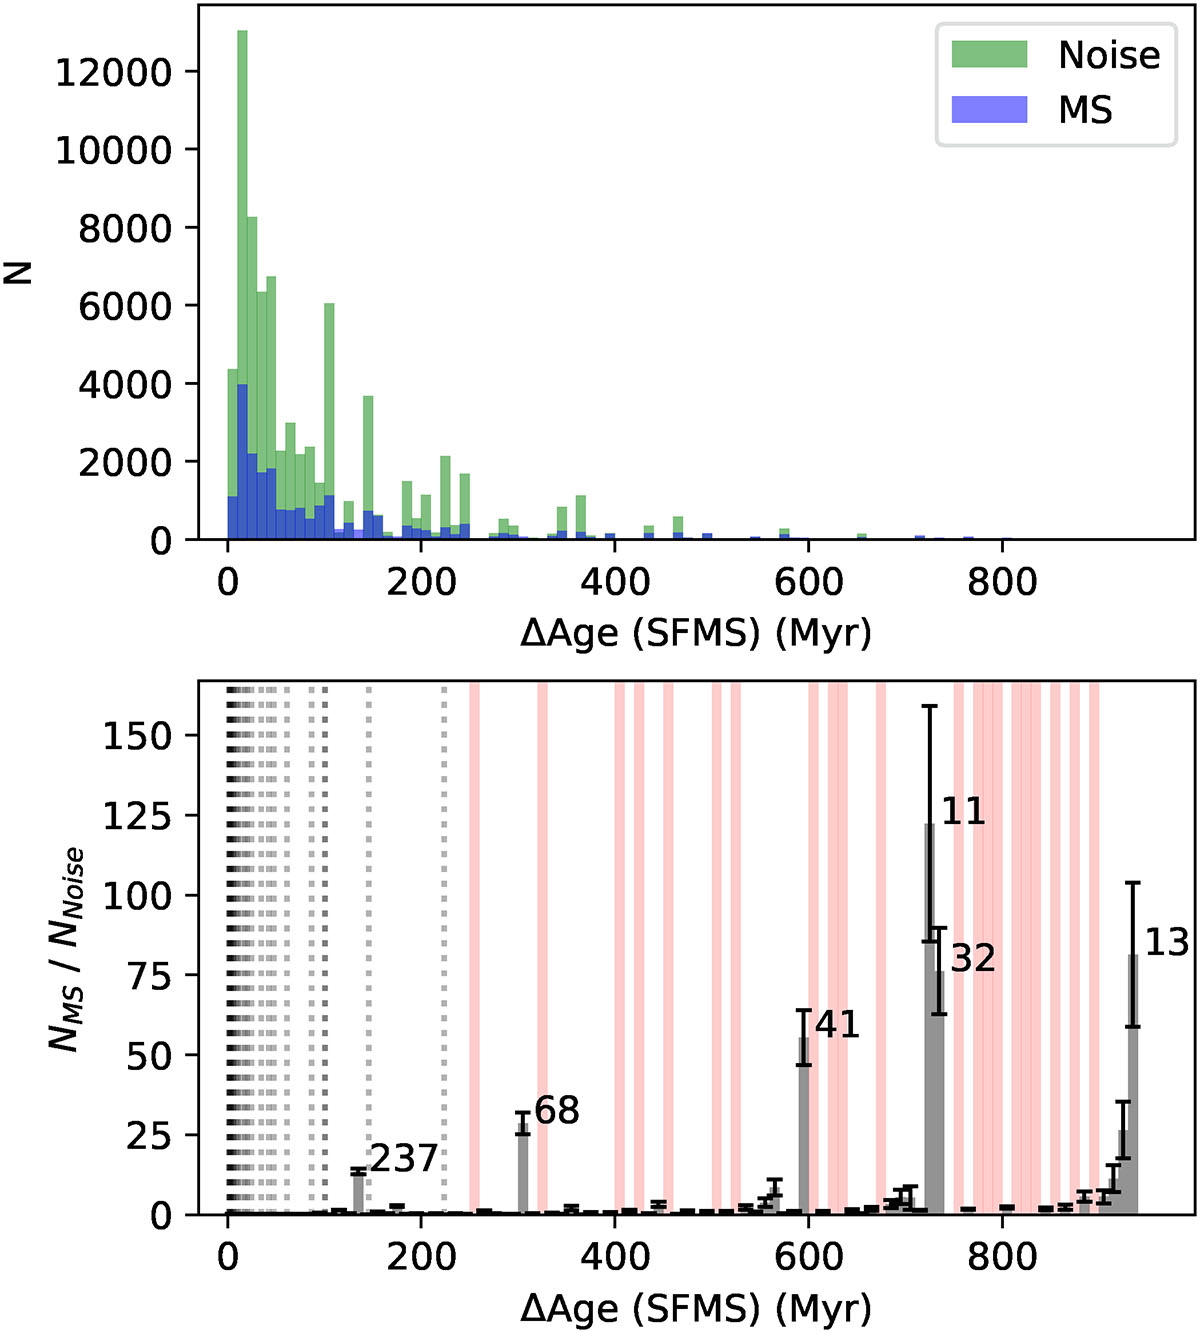
Distribution of ΔAge intervals for galaxies within the MS, sampled in ΔAge bins 10 Myr wide. Top: Our measured distribution compared to that resulting from imposing noise as the separation from the SFMS at each age value (see Appendix B). Bottom: Ratio between the measured and noise-generated intervals for each bin. The peaks correspond to statistically overrepresented intervals in the measurements. Black bars show the error estimated assuming that the number of intervals measured follows a Poisson distribution. Dotted lines show the age intervals between age bins within the last 1 Gyr, and red shaded areas indicate the bins for which no combination of consecutive age bins is possible and therefore cannot be produced.
Current usage metrics show cumulative count of Article Views (full-text article views including HTML views, PDF and ePub downloads, according to the available data) and Abstracts Views on Vision4Press platform.
Data correspond to usage on the plateform after 2015. The current usage metrics is available 48-96 hours after online publication and is updated daily on week days.
Initial download of the metrics may take a while.