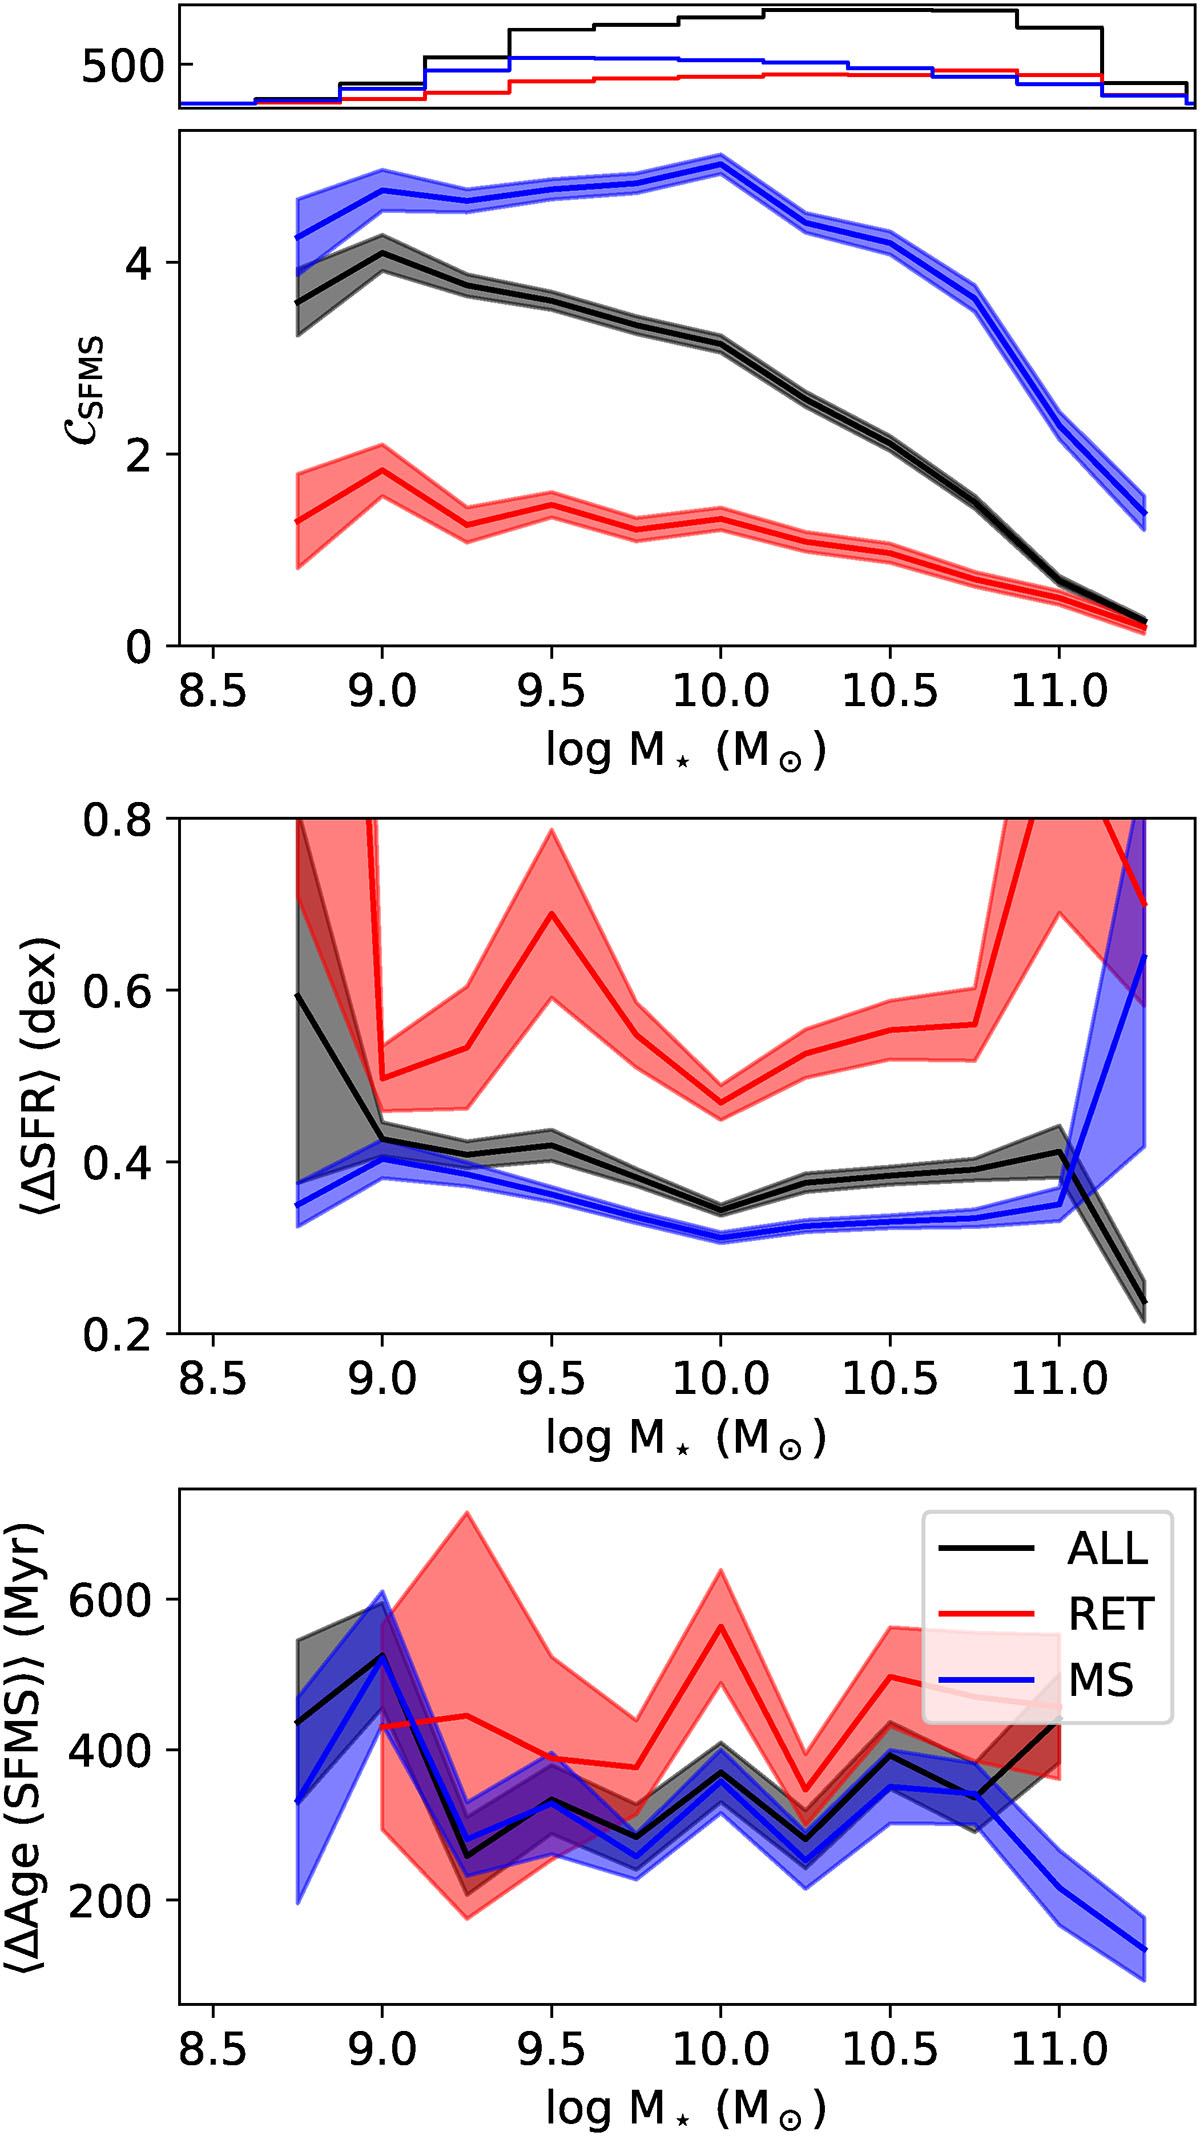
Fig. 7.
Download original image
Properties related to the crossings of the SFMS compared to M★, for the three groups of galaxies considered: ALL (black), MS (blue), and RET (red). Top: Distribution of the galaxies in M★. Second pane: Average number of crossings (𝒞SFMS) for each M★. Third panel: ΔSFR in dex after a crossing has happened. Fourth pane: Average interval (ΔAge) between crossings for the galaxies, in Myr. For the bottom three panels, the shaded areas correspond to the error of the mean.
Current usage metrics show cumulative count of Article Views (full-text article views including HTML views, PDF and ePub downloads, according to the available data) and Abstracts Views on Vision4Press platform.
Data correspond to usage on the plateform after 2015. The current usage metrics is available 48-96 hours after online publication and is updated daily on week days.
Initial download of the metrics may take a while.