Fig. 12.
Download original image
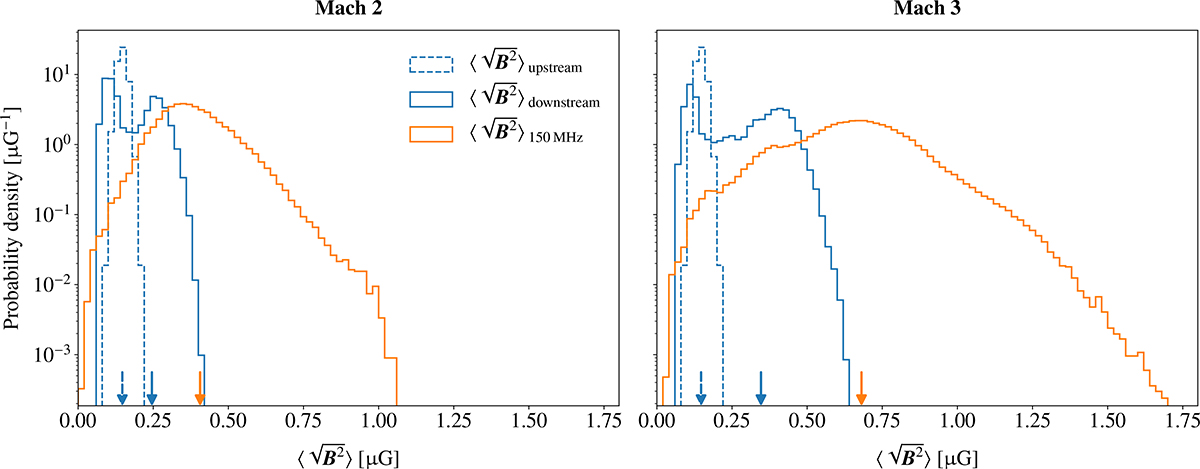
Left: Probability density distributions of the projected magnetic field strength in our fiducial Mach 2 simulation. Solid (dashed) lines represent projections through the shock-compressed region at t = 250 Myr (high-resolution region at t = 0 Myr). Blues lines represent volume-weighting, whilst orange lines represent synchrotron-weighting, where the synchrotron emission is calculated at ν = 150 MHz. Arrows are placed at the RMS magnetic field strength calculated for each distribution. Right: As previous, except data come from the fiducial Mach 3 simulation. Synchrotron-weighting significantly overestimates the average magnetic field strength. Magnetic field values are able to reach μG values even in weaker shocks, although amplification is more effective at higher Mach number shocks.
Current usage metrics show cumulative count of Article Views (full-text article views including HTML views, PDF and ePub downloads, according to the available data) and Abstracts Views on Vision4Press platform.
Data correspond to usage on the plateform after 2015. The current usage metrics is available 48-96 hours after online publication and is updated daily on week days.
Initial download of the metrics may take a while.